Proximity sensors are essential components in modern industrial automation, providing non-contact detection of metallic or non-metallic objects. Understanding the correct installation and wiring through detailed diagrams ensures optimal performance, reliability, and safety in various applications such as conveyor systems, robotic arms, and machine guarding. This article outlines key principles for interpreting proximity sensor diagrams and implementing best practices in industrial settings.
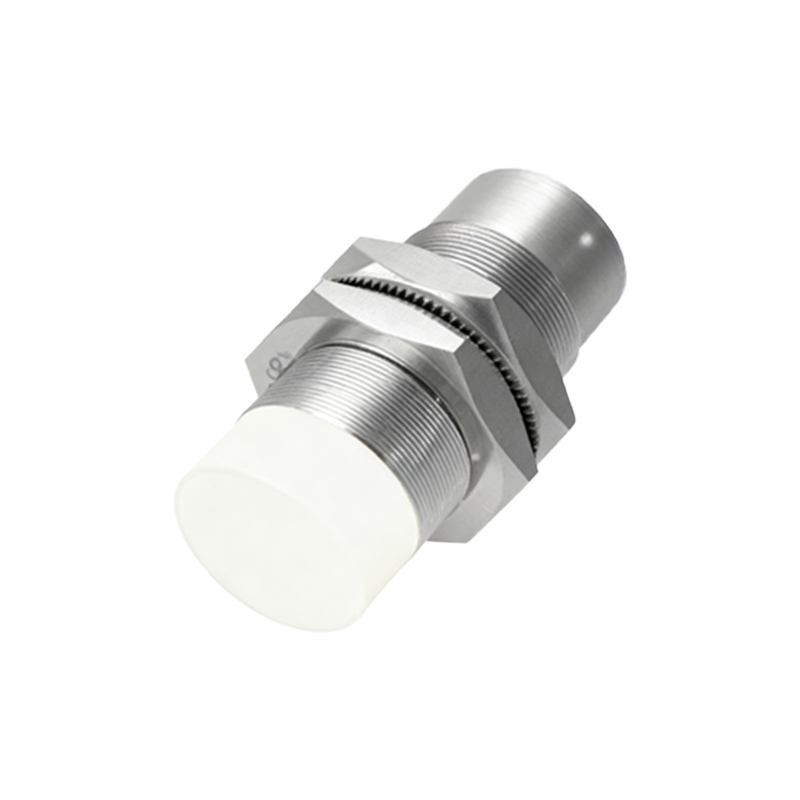
A standard proximity sensor installation diagram typically includes the sensor unit, power supply connections, load (often a PLC input or relay), and grounding points. For DC sensors, the diagram specifies three wires: brown for positive voltage supply, blue for negative or common, and black for the output signal. AC sensors may have two or three wires, with diagrams clearly marking live, neutral, and output terminals. Diagrams also indicate critical distances, such as the sensing range, installation clearance between sensors, and recommended gaps from metal surfaces to prevent interference. For example, a cylindrical inductive sensor diagram shows minimum lateral spacing of twice the sensor diameter and axial spacing of three times the sensing range to avoid mutual interference.
Wiring diagrams emphasize proper shielding and grounding to minimize electrical noise, especially in environments with variable frequency drives or welding equipment. Shielded cables should be grounded at the control panel end only, forming a single-point ground to avoid ground loops. Diagrams often include surge protection devices or flyback diodes for inductive loads to protect sensor outputs from voltage spikes. For hazardous areas, diagrams specify intrinsically safe barriers or explosion-proof enclosures, with clear separation between safe and hazardous zone wiring.
Mounting orientation significantly affects performance. Diagrams illustrate correct alignment relative to target materials and movement direction. For instance, a capacitive sensor diagram highlights parallel positioning to flat surfaces for consistent detection, while ultrasonic sensor diagrams show beam angle considerations to avoid false triggers from background objects. Adjustable sensitivity or timing delay functions, represented by potentiometer symbols in diagrams, allow fine-tuning for specific applications like detecting small parts or ignoring transient objects.
Maintenance and troubleshooting diagrams provide guidance on LED indicator states, wiring checks, and diagnostic steps. A flashing LED might indicate overload or short circuit, prompting verification of cable integrity and load compatibility. Diagrams also remind technicians to power off circuits before modifications and verify sensor specifications against environmental factors like temperature, humidity, and chemical exposure.
In summary, proximity sensor diagrams are vital tools for ensuring correct installation and operation. By adhering to diagram specifications—including wiring, spacing, grounding, and mounting guidelines—engineers can enhance system longevity, reduce downtime, and maintain safety. Regular reference to manufacturer diagrams during installation and maintenance prevents common errors and supports efficient automation workflows.