In modern industrial manufacturing, laser cutting machines have become indispensable high-precision processing equipment. Their performance and accuracy heavily rely on the sophisticated integration of various sensors. This article delves into the structural diagram and functional analysis of key sensors within a laser cutting system, providing a comprehensive overview for engineers and technicians in the electrical and automation fields.
A typical laser cutting machine sensor system can be conceptually divided into several core functional blocks, each represented in a detailed structural diagram. The primary categories include positioning and motion control sensors, process monitoring sensors, and safety and environmental sensors.
1. Positioning and Motion Control Sensors
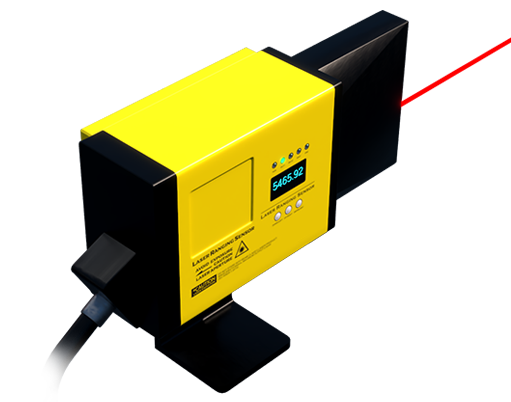
This subsystem is the foundation for accurate cutting paths. Its structural diagram typically features:
* Linear Encoders: Often optical or magnetic, they are mounted along the X, Y, and sometimes Z axes. The diagram shows their placement on the guide rails, directly coupled to the moving gantry or cutting head. They provide real-time, high-resolution feedback on position to the motion controller, forming a closed-loop system that corrects for any mechanical backlash or error.
* Rotary Encoders: Integrated into the servo motors driving each axis. The structural diagram illustrates their internal components: a light source, a coded disk, and a photodetector array. They measure motor shaft rotation, enabling precise control of speed and angular position.

* Proximity Sensors (Limit Switches): Depicted at the extreme ends of each axis travel in the diagram. These are typically inductive or capacitive sensors that define the machine's physical boundaries, preventing over-travel and potential damage.
2. Process Monitoring Sensors
This group directly monitors the cutting operation itself. A functional diagram of this subsystem is crucial for quality assurance.
* Capacitive or Inductive Height Sensors: A detailed cross-sectional diagram shows this sensor integrated into the cutting head. It maintains a constant, optimal distance (stand-off) between the nozzle and the workpiece by measuring capacitance or inductance changes. This is critical for consistent cut quality, especially on uneven surfaces.
* Beam Path Monitoring Sensors: These include photodiodes or CCD sensors positioned at strategic points, as shown in a beam delivery diagram. They monitor laser power stability, beam centering, and focus point position. Some systems include pyrometers or thermal cameras (illustrated as separate units pointing at the cutting kerf) to monitor the temperature of the cut zone in real-time, allowing for dynamic parameter adjustment.
* Gas Pressure and Flow Sensors: Mounted within the assist gas (e.g., Oxygen, Nitrogen) line. The pneumatic diagram shows pressure transducers and mass flow controllers ensuring the correct gas parameters are delivered to the nozzle, which is vital for cutting different materials and thicknesses.
3. Safety and Environmental Sensors
This subsystem protects both the machine and the operator. Its layout diagram is integrated into the machine's overall safety circuit.
* Light Curtains or Laser Safety Scanners: The diagram shows these devices creating an invisible protective field around the cutting area. If breached, they send an immediate stop signal to the laser source and motion system.
* Temperature Sensors: Thermocouples or RTDs (Resistance Temperature Detectors) are shown attached to critical components like the laser resonator, optics, and main spindle bearings. They provide feedback to cooling systems and trigger alarms if temperatures exceed safe thresholds.
* Smoke and Fume Extraction Sensors: Differential pressure sensors can be illustrated in the extraction ductwork to monitor filter clogging and ensure efficient removal of cutting byproducts.
Functional Integration and Data Flow
A high-level system block diagram ties all these sensors together. It depicts the flow of data from each sensor type to the central Machine Control Unit (MCU) or PLC. Analog signals (e.g., from temperature or pressure sensors) are converted via ADCs. Digital signals (e.g., from encoders) are processed directly. The MCU uses this data to execute the cutting program while making real-time adjustments and logging process data for analysis and predictive maintenance.
Conclusion
Understanding the laser cutting machine sensor structure diagram is not merely about recognizing individual components. It is about comprehending the interconnected system that transforms raw commands into precise, reliable, and safe physical cuts. From the nanometer-scale feedback of linear encoders to the macro-level protection of light curtains, each sensor plays a vital role. For engineers, mastering this sensor ecosystem is key to optimizing machine performance, troubleshooting issues, and pushing the boundaries of cutting precision and automation in modern manufacturing.