In industrial automation and machinery design, proximity sensors play a crucial role in non-contact detection and position sensing. Among the various tools used for their specification and selection, the proximity sensor cylinder chart stands out as an essential reference. This guide delves into the purpose, interpretation, and practical application of these charts, providing clear insights for engineers, technicians, and procurement specialists.
A proximity sensor cylinder chart is a standardized graphical representation, typically provided by sensor manufacturers. Its primary function is to illustrate the detection characteristics of a cylindrical inductive or capacitive proximity sensor. The chart visually maps the sensor's effective sensing range or field in relation to its physical cylindrical body. Understanding this chart is fundamental to ensuring a sensor is correctly specified for a given application, preventing common installation errors like insufficient detection distance or false triggers.
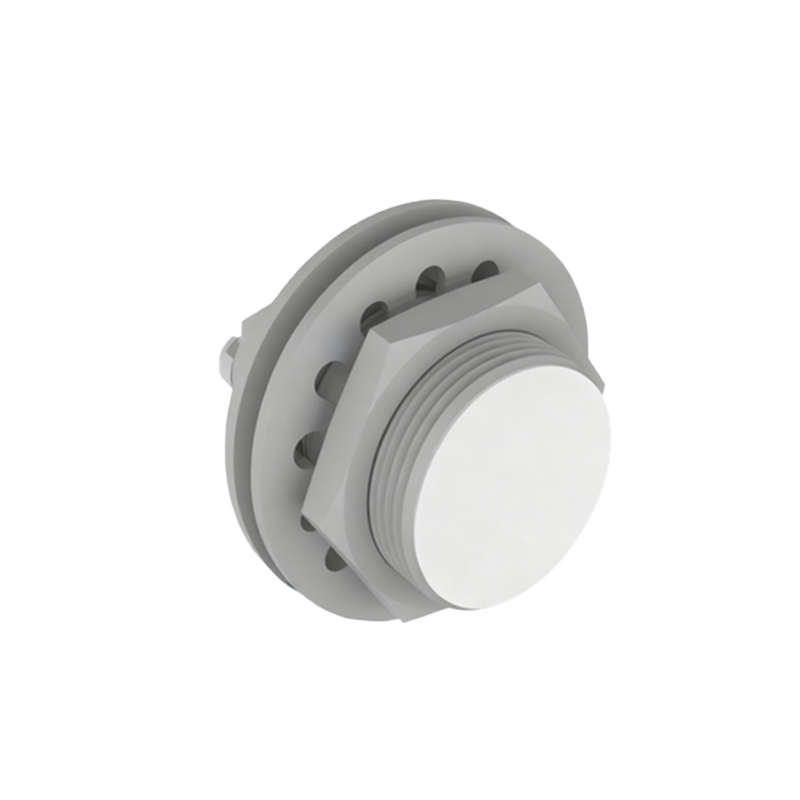
The core component of the chart is a cross-sectional diagram of the sensor's cylindrical housing. Radiating from the active sensing face—usually the flat end of the cylinder—are a series of concentric contour lines or shaded areas. These lines define zones of reliable detection. The most critical parameter shown is the rated operating distance, or 'Sn'. This is the nominal sensing range for a standard target, usually a square of mild steel of a defined size for inductive sensors. The chart clearly demarcates this distance.
However, the true value of the cylinder chart lies in its depiction of how the sensing field behaves beyond this simple point measurement. It shows the sensor's lateral sensing characteristics. The field is not a perfect, narrow cylinder extending only straight ahead; it has a three-dimensional shape, often slightly conical or bell-shaped. The chart illustrates the decrease in effective range as a target moves off-axis from the center of the sensor face. This is vital for applications where targets may not be perfectly aligned or where there is potential for side-approach detection.
Furthermore, the chart often includes information about the reduction factor for different materials. For inductive sensors, the detection range for non-ferrous metals like aluminum or copper is shorter than for steel. A cylinder chart may include separate contour lines or notes indicating the adjusted sensing field when detecting these alternative metals. This prevents underestimation of sensor capabilities in mixed-material environments.
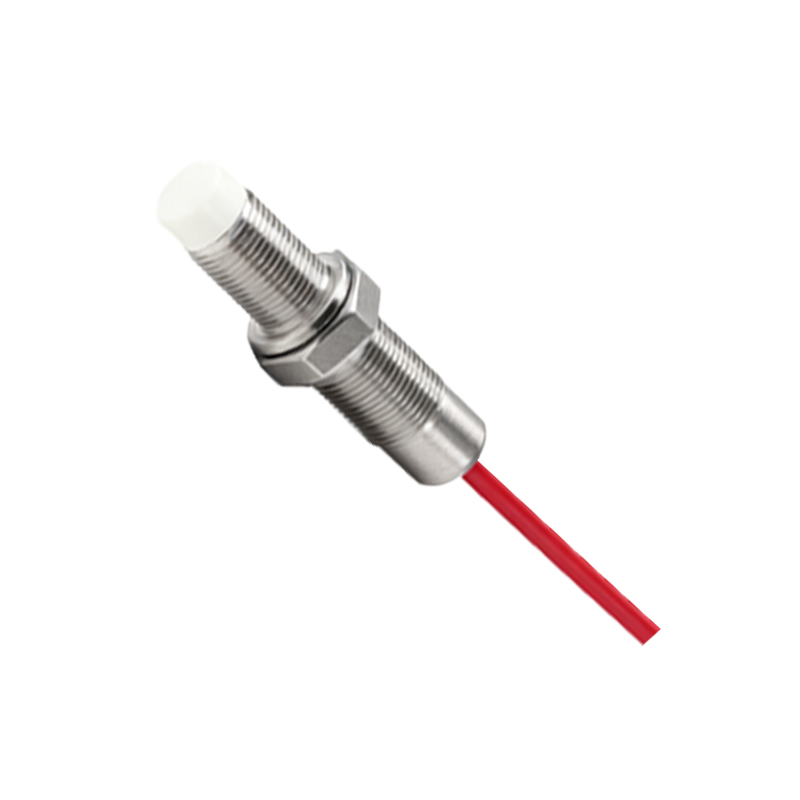
For capacitive sensors, which detect both metallic and non-metallic materials, the cylinder chart is equally important but interprets different variables. It might show how the sensing field is influenced by the dielectric constant of the target material (e.g., plastic, wood, liquid) or the presence of background materials. The shape of the field can be wider, emphasizing the need to consider lateral interference from nearby objects not intended to be detected.
Practical application of the chart begins during the design phase. When integrating a sensor into a machine layout, engineers must consult the cylinder chart to ensure the target will pass through the reliable detection zone. This involves checking not just the frontal distance but also the allowable lateral tolerance. It helps in determining the optimal mounting position—whether flush-mounted or non-flush-mounted—as this significantly affects the shape and size of the sensing field. Non-flush mountable sensors, for instance, have an extended lateral field which the chart clearly depicts.
During installation and maintenance, technicians use the chart for troubleshooting. If a sensor is intermittently failing to detect a target, comparing the actual target path and position with the chart's detection zones can reveal misalignment or the presence of an unintended object within the sensor's lateral field causing interference. It serves as a diagnostic blueprint.
In summary, the proximity sensor cylinder chart is far more than a simple specification sheet graphic. It is a functional map of the sensor's detection personality. Mastery of its interpretation leads to more robust system designs, fewer sensor failures, and optimized machine performance. By always cross-referencing application requirements with this standardized chart, professionals can select the right sensor with confidence, ensuring reliable operation in the demanding world of industrial automation. Always refer to the specific manufacturer's chart for the exact model in use, as characteristics can vary between product families and technologies.