Proximity switch sensors are fundamental components in modern industrial automation and countless electronic devices. Understanding their operation is greatly enhanced by examining a proximity switch sensor diagram. This visual representation demystifies the internal workings and clarifies how these non-contact sensors detect the presence or absence of an object.
At its core, a standard proximity sensor diagram reveals several key sections. The sensor head houses the critical sensing element. In an inductive proximity sensor diagram, this would show a coil generating an oscillating electromagnetic field. When a metallic target enters this field, the diagram illustrates eddy currents induced in the target, causing a change in the oscillation amplitude. This change is detected by the circuit, triggering a switch in the output state. A capacitive proximity sensor diagram, in contrast, would depict the sensor face as one plate of a capacitor and the target as the other. The diagram shows how the capacitance changes as a target approaches, altering the internal oscillator's state and subsequently switching the output.
The central processing unit or oscillator block is another critical part shown in the diagram. It processes the signal change from the sensing element. Following this, the output stage is clearly depicted. Most diagrams label the type of output, such as a transistor (PNP or NNP sourcing/sinking) or a relay contact symbol. The wiring connections—typically for power supply (Vcc/Brown, GND/Blue) and the output signal (Black or White wire)—are explicitly shown, which is invaluable for installation and troubleshooting. Many diagrams also include symbols for the load, like a programmable logic controller (PLC) input or a relay coil, connected to the sensor's output wire.
Different sensing technologies have distinct diagrammatic representations. An optical proximity sensor diagram will clearly show the LED light source and the phototransistor or photodiode receiver. It illustrates the through-beam, retro-reflective, and diffuse reflection modes. Ultrasonic sensor diagrams feature a transducer for emitting and receiving sound waves, with timing circuits crucial for calculating distance based on the echo return time.
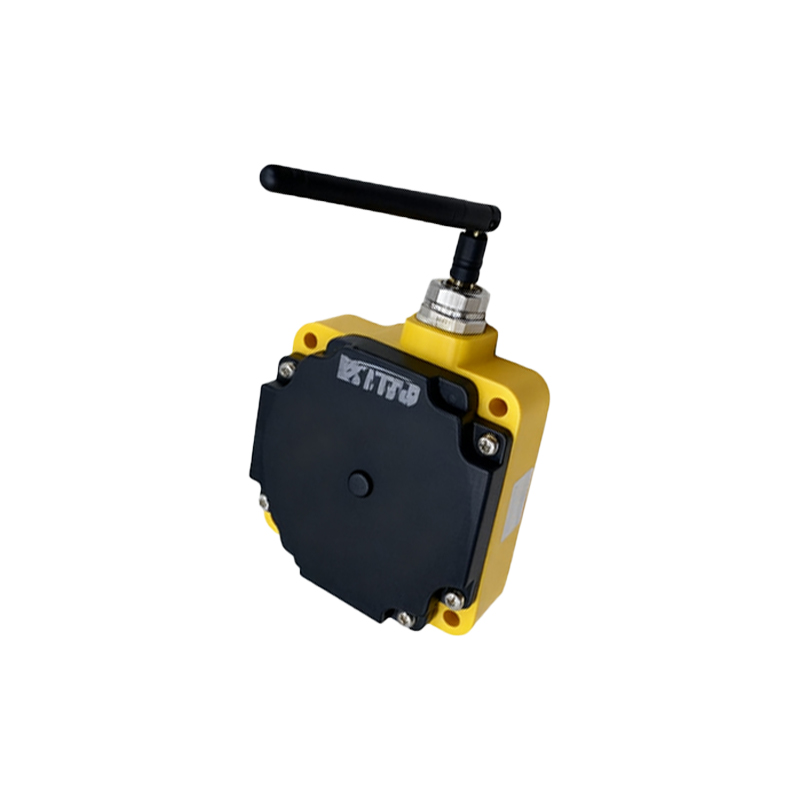
Reading a proximity switch sensor diagram is essential for correct application. Key specifications are often derived from it. The sensing range, or the maximum distance at which the sensor can reliably detect a standard target, is a primary takeaway. The diagram also helps identify the sensor's normal state, either Normally Open (NO) or Normally Closed (NC). The output configuration (digital on/off or analog, PNP vs. NPN) is unmistakably clear from the schematic symbols. Furthermore, diagrams often indicate the presence of protection circuits against short-circuits, reverse polarity, and electrical noise, shown as additional components like diodes, capacitors, and resistors within the housing.
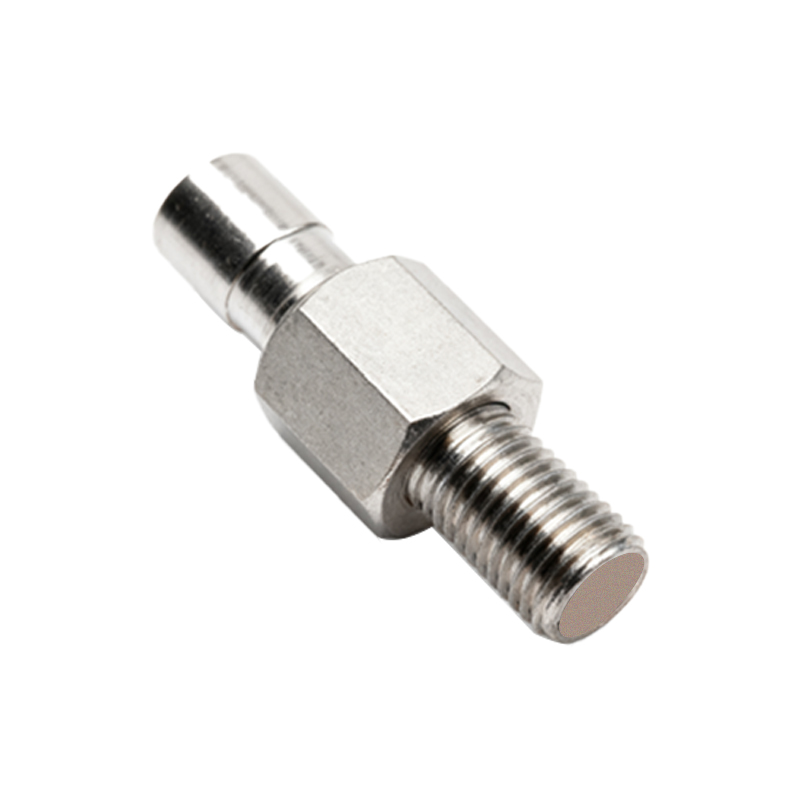
The practical applications of these sensors are vast, and the diagram informs their selection. In manufacturing, inductive sensors, as per their diagrammatic principle, monitor metal parts on conveyor belts, count products, or confirm robotic arm positions. Capacitive sensors, visualized in their diagrams, can detect non-metallic materials like liquids, plastics, or wood, used in level detection or packaging lines. Optical sensors, with their clear emitter-receiver diagrams, are ubiquitous in safety curtains, object counting, and precision positioning. Ultrasonic sensors, detailed in their echo-time diagrams, provide reliable presence detection and distance measurement in challenging environments with dust or moisture, such as bulk material handling or parking assistance systems.
When integrating a proximity sensor, the diagram is the first reference point. It ensures proper wiring to avoid damage. For instance, connecting a PNP (sourcing) sensor to a sinking input module will not work, a fact immediately apparent from the output stage of the diagram. Diagrams also aid in diagnostics. If a sensor fails, technicians reference the diagram to test voltage at different points, from the power supply terminals to the output signal in relation to the target's presence.
In summary, a proximity switch sensor diagram is far more than a simple illustration; it is a functional blueprint. It bridges the gap between theoretical operation and practical implementation. By learning to interpret the symbols and flow within a proximity sensor circuit diagram, engineers, technicians, and enthusiasts can select, install, and maintain these sensors effectively, ensuring reliability and efficiency in automated systems across all industries. From simple object detection to complex positional feedback, the humble proximity sensor, as detailed in its diagram, remains a cornerstone of automated control.