Proximity sensors are fundamental components in modern automation, providing non-contact detection of objects. Their operation is best understood not just by their physical specifications, but by analyzing their electrical output—the proximity sensor waveform. This signal tells a comprehensive story about the sensor's health, performance, and interaction with its target.
At its core, a proximity sensor converts the physical presence or absence of an object into a clean electrical signal. For DC-powered sensors, which are the most common in industrial settings, this typically results in a digital output: a high voltage (e.g., 24V) representing a detected object and a low voltage (near 0V) representing no target. The transition between these two states is not instantaneous. The waveform captured on an oscilloscope reveals critical timing parameters: the response time. This is the delay between the target entering the sensing range and the output signal switching. A clean, sharp transition in the waveform indicates optimal performance, while a slow, sloping transition can signal issues like a weakening sensor, insufficient power supply, or electrical noise interference.
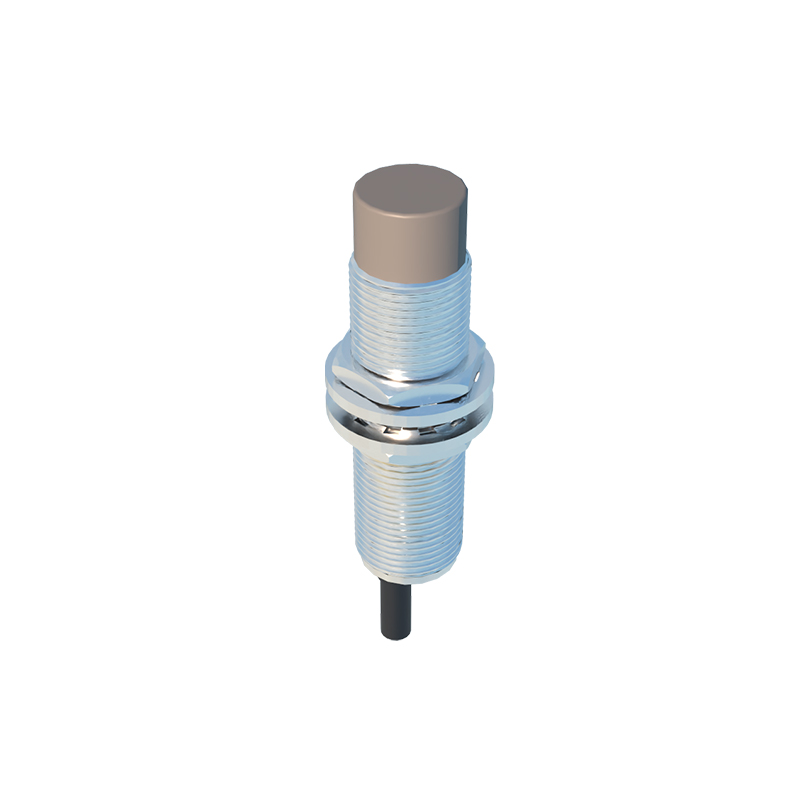
The waveform's characteristics vary significantly between different sensor technologies. Inductive proximity sensors, used for detecting metals, generate a waveform that shows how the internal oscillator's amplitude dampens when a metallic target approaches, eventually triggering the output switch. Capacitive sensors, capable of detecting non-metallic materials, produce waveforms that reflect changes in capacitance, often with different rise and fall characteristics. Understanding these nuances is key to selecting the right sensor for an application involving plastics, liquids, or granular materials.
Analyzing the waveform is a powerful diagnostic tool. An ideal square wave with flat tops and bottoms signifies a healthy sensor in a clean electrical environment. Real-world waveforms, however, often tell a different story. Ripple or noise on the high signal can indicate problems with the power supply or grounding issues. Overshoot or ringing at the transition edges often points to impedance mismatches or reflected electrical noise in long cable runs. A waveform that fails to reach the full supply voltage level suggests a potential internal fault or an excessive load on the output. Regular waveform checks can predict failures before they cause unplanned downtime.
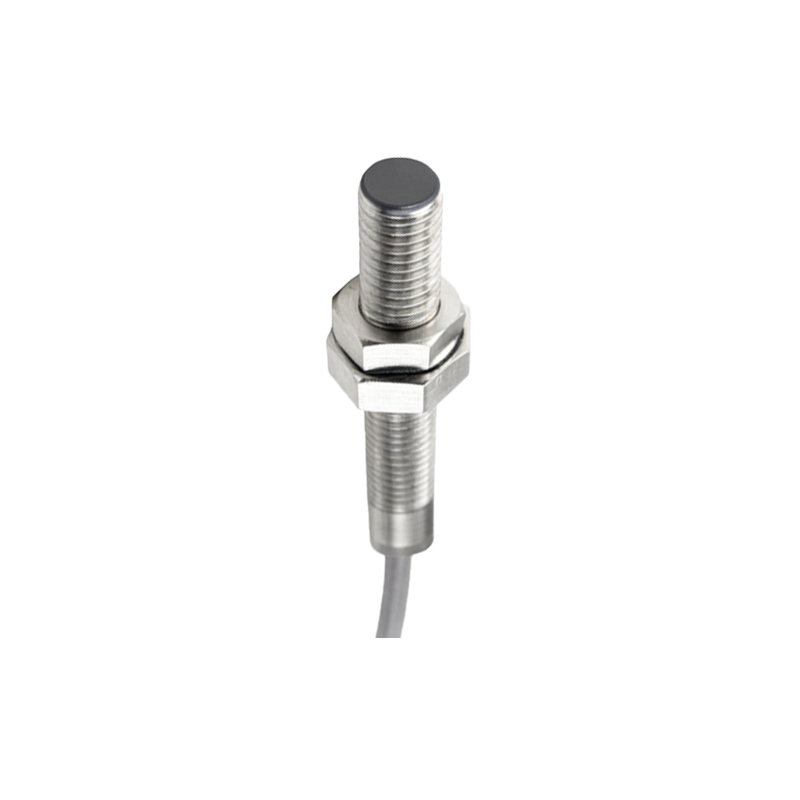
Furthermore, the concept of hysteresis is clearly visible in a waveform analysis. Hysteresis is the difference between the switch-on point (as the target approaches) and the switch-off point (as it moves away). This built-in feature prevents output chatter when a target is positioned at the very edge of the sensing range. On a waveform plot showing target distance versus output voltage, hysteresis appears as a small gap between the activation and deactivation curves, ensuring a stable, single switching event even with vibration or minor target movement.
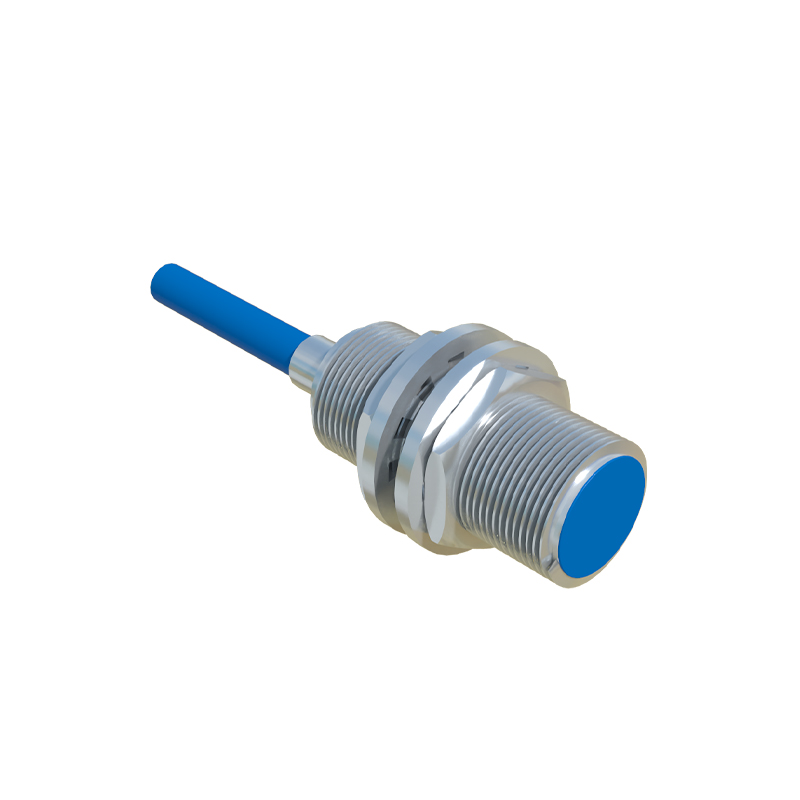
For engineers and technicians, interpreting these waveforms is essential for troubleshooting. When a machine behaves erratically, connecting an oscilloscope to the sensor's output wire can immediately distinguish between a mechanical timing issue and an electrical sensor problem. Is the switch happening too late? The waveform shows the exact response delay. Is the output flickering? The waveform will show the signal bouncing between high and low states. This objective data moves diagnosis beyond guesswork, enabling precise corrections such as adjusting sensor position, installing shielding, or adding filter circuits to suppress noise.
In high-speed applications like counting, sorting, or precision positioning, the waveform's integrity is paramount. Any distortion or delay directly translates to a loss of accuracy or throughput. Here, sensors with faster response times, evidenced by steeper waveform edges, are mandatory. The waveform analysis validates that the sensor can keep pace with the machine's cycle time without introducing errors.
In conclusion, the humble proximity sensor waveform is a window into the soul of an automated system. Moving beyond a simple "on/off" mentality to an analysis of signal quality, timing, and stability empowers maintenance and design engineers. It facilitates better sensor selection, ensures reliable system integration, and provides a clear, unambiguous method for diagnosing faults. In the pursuit of maximum equipment effectiveness and minimal downtime, mastering the interpretation of these electrical signatures is not just useful—it is indispensable.