SEO关键词:photoelectric sensor, pulse waveform display, PPG signal conditioning, analog circuit design, digital filtering
Photoelectric sensors, leveraging the photoplethysmography (PPG) principle, are widely used in non-invasive biomedical and industrial monitoring. In electrical engineering, displaying these pulse waveforms accurately requires understanding signal acquisition, noise filtering, and analog-to-digital conversion. The PPG signal, obtained by detecting light absorption changes in blood vessels, typically features a DC component (tissue absorption) and an AC component (pulsatile blood flow). Engineers must design circuits to extract the AC signal, which ranges from 0.1 to 10 Hz, while rejecting ambient light and motion artifacts.
Sensor Circuit Design and Signal Conditioning
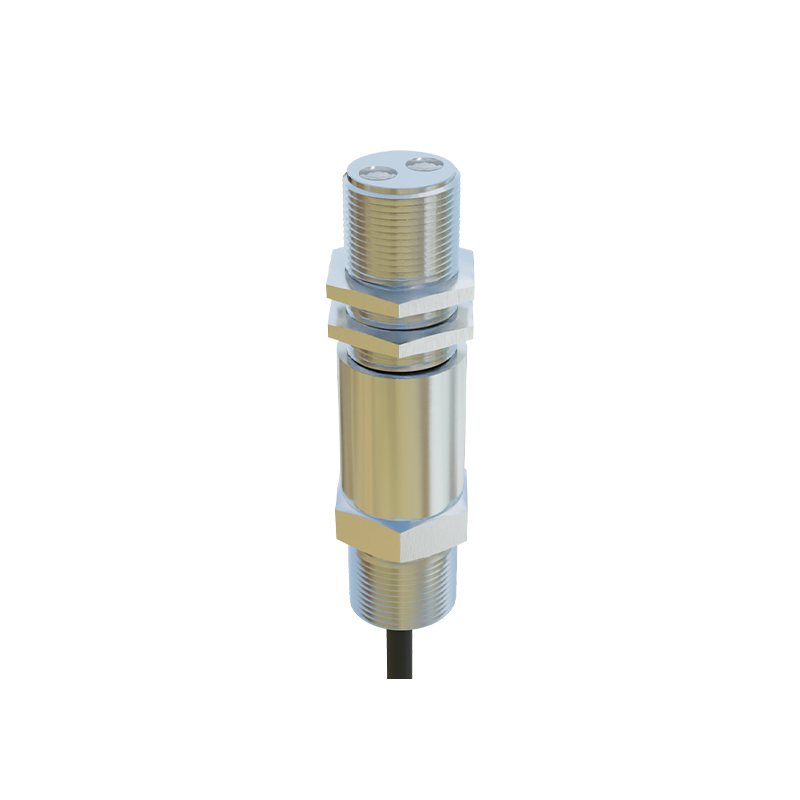
A typical photoelectric sensor circuit includes an infrared LED (e.g., 940 nm) and a photodiode or phototransistor. The photodiode current is converted to a voltage via a transimpedance amplifier (TIA) with a feedback resistor of 1 MΩ to 10 MΩ for sensitivity. A high-pass filter (cutoff ~0.5 Hz) removes the DC baseline, followed by a low-pass filter (cutoff ~20 Hz) to suppress high-frequency noise. Operational amplifiers like the AD8605 or OPA333 ensure low noise and rail-to-rail output. For display, the conditioned signal is fed into an ADC (e.g., ADS1115 with 16-bit resolution at 860 SPS) and processed by a microcontroller.
Data Acquisition and Sampling Strategies
To display a stable pulse waveform, sampling at 100 Hz to 200 Hz is recommended to capture the heart rate’s fundamental frequency (typically 1-2 Hz). An anti-aliasing filter before ADC prevents spectral folding. The microcontroller (e.g., STM32F4 series) uses DMA to buffer data efficiently. Engineers should implement a moving average filter (window size 5-10 samples) to smooth transients. For real-time visualization, data is sent via UART or USB to a PC or OLED display, updating at 20-50 frames per second.
Digital Signal Processing for Waveform Enhancement
Raw PPG signals often contain baseline drift and motion artifacts. Engineers apply a bandpass filter (0.5-10 Hz) using FIR or IIR coefficients (e.g., Butterworth order 4) in firmware. Adaptive filtering, such as the LMS algorithm, can reduce motion noise by referencing an accelerometer. For peak detection, a threshold-based method (e.g., 60% of moving average amplitude) identifies systolic peaks. The waveform is then scaled to a 0-3.3 V range for display, ensuring the true pulse morphology—including the dicrotic notch—is preserved.
Display Hardware and Visualization Techniques
Common display options include TFT LCDs (e.g., ILI9341 with 320x240 resolution) or OLED screens for portable devices. The waveform is plotted as a scrolling graph: the X-axis represents time (e.g., 5 seconds window), and the Y-axis maps ADC values (12-bit to 4096). Engineers use double buffering to avoid flicker. For quantitative analysis, overlay heart rate (BPM) and SpO2 readings if dual-wavelength sensors are used. The final display should have a grid background for readability and color-coded traces (e.g., red for raw data, green for filtered).
Practical Considerations and Calibration
Calibration is essential for accurate waveform display. Engineers test the system with a finger-clip sensor on a subject at rest. Adjust the TIA gain to ensure the AC signal amplitude reaches 50-80% of the ADC range. Validate the pulse rate against an ECG reference (error< 2%). For industrial applications, account for temperature drift by using temperature-compensated LEDs. Finally, implement a watchdog timer to reset the sensor if the signal is lost, ensuring robust operation in continuous monitoring.