In the realm of industrial automation, consumer electronics, and safety systems, proximity sensor images represent a critical visual translation of non-contact detection technology. These images are not photographs in the traditional sense, but rather graphical representations, diagrams, and output visualizations that illustrate how proximity sensors operate, their physical form, and the data they generate. Understanding these images is key to selecting, implementing, and troubleshooting these ubiquitous components.
At its core, a proximity sensor detects the presence or absence of an object within a specified range without physical contact. Common technologies include Inductive (for metals), Capacitive (for metals and non-metals), Ultrasonic (using sound waves), and Optical (using infrared light). A typical proximity sensor image found in a datasheet or catalog will depict the sensor housing, often cylindrical or rectangular, with critical dimensions labeled. Key visual elements include the sensing face, LED indicators for power and output status, and connection points for wiring. Diagrams often show the detection zone, usually represented as a conical or cylindrical field emanating from the sensor face, clarifying its effective range and beam pattern.
Beyond physical diagrams, "proximity sensor images" can refer to the graphical output of sensing systems. For instance, in complex machinery, a network of sensors might feed data into a SCADA (Supervisory Control and Data Acquisition) system. The system's interface displays a schematic image of the machine, with icons for each sensor changing color—from green to red, for example—to indicate the presence or absence of a part at a specific station. This visual feedback allows operators to monitor an entire assembly line at a glance. Similarly, in automotive applications, a visual parking aid display uses data from ultrasonic proximity sensors to create a simple image or diagram of the car and colored bars representing distance to obstacles.
Analysis of these images and diagrams is crucial for system design. Engineers must interpret dimensional drawings to ensure proper mechanical mounting. They study detection range graphs, which plot sensing distance against target material or size, to choose the correct sensor for an application. For example, an inductive sensor's range graph will show a significant drop-off for non-ferrous metals compared to steel. Furthermore, timing diagrams are another vital form of imagery. These waveforms illustrate the sensor's output signal (on/off) in relation to a target entering and leaving the sensing field, including details like response time and switching hysteresis.
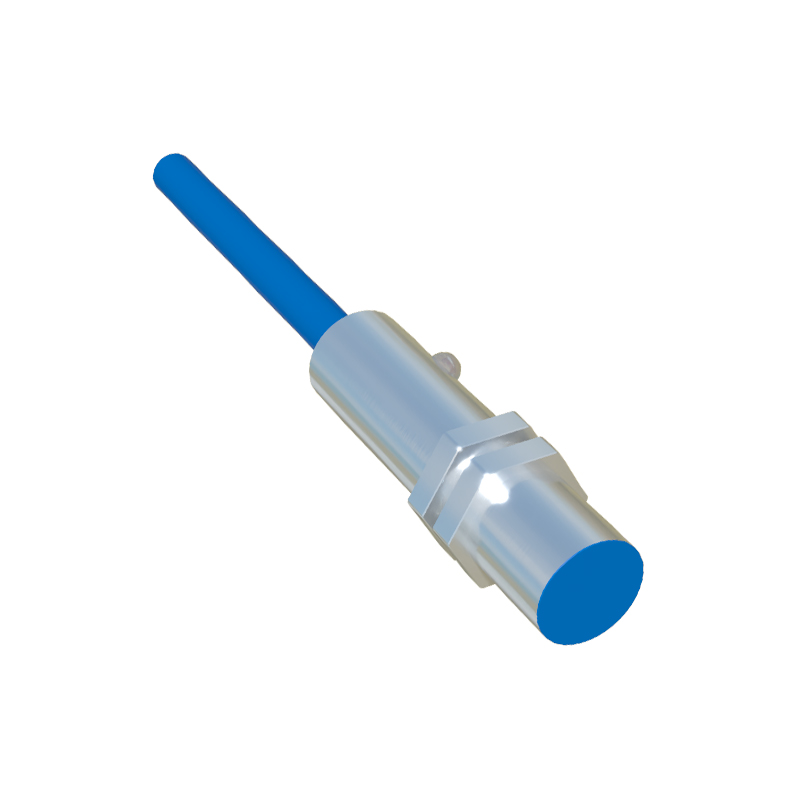
The applications are vast and reflected in the types of images associated with them. In smartphone technology, a small infrared proximity sensor near the earpiece prevents accidental screen touches during calls. Teardown images and component layout diagrams highlight its miniature size and placement. In manufacturing, images show cylindrical inductive sensors mounted on robotic arms for precise part positioning, or capacitive sensors inspecting fill levels through plastic or glass containers. Safety curtain systems, consisting of arrays of optical sensors, are represented by images showing their protective light grids around dangerous machinery.
When searching for or interpreting proximity sensor images, focus on clarity and source reliability. Manufacturer datasheets provide the most accurate technical drawings and performance graphs. Look for images that specify the sensing technology, nominal sensing distance, supply voltage, output type (PNP/NPN, analog), and environmental ratings like IP67 for dust and water resistance. Avoid generic stock photos that lack technical detail. For troubleshooting, comparison images showing correct versus incorrect installation—such as the effects of sensor flush-mounting versus non-flush mounting in metal—are invaluable.
In conclusion, proximity sensor images serve as the essential bridge between the abstract functionality of non-contact detection and practical real-world application. From detailed engineering drawings to dynamic system interface icons, these visuals empower professionals to design smarter systems, perform accurate maintenance, and understand the invisible fields that automate our world. By learning to read these images, one gains deeper insight into the silent, unseen workhorses of modern technology.