Introduction to Potential-Type Photoelectric Sensors
Potential-type photoelectric sensors, also known as voltage-output photoelectric sensors, are critical components in industrial automation, object detection, and process control. These sensors convert light intensity variations into an electrical potential, typically a voltage signal that is proportional to the received light. Unlike current-type sensors, which measure current flow, potential-type sensors provide a direct voltage output that simplifies integration with analog-to-digital converters and PLC systems. This article explores the role of sensor images in understanding device structure, wiring, and application scenarios, focusing on technical specifications and best practices for electrical engineers.
Key Components in Photoelectric Sensor Images
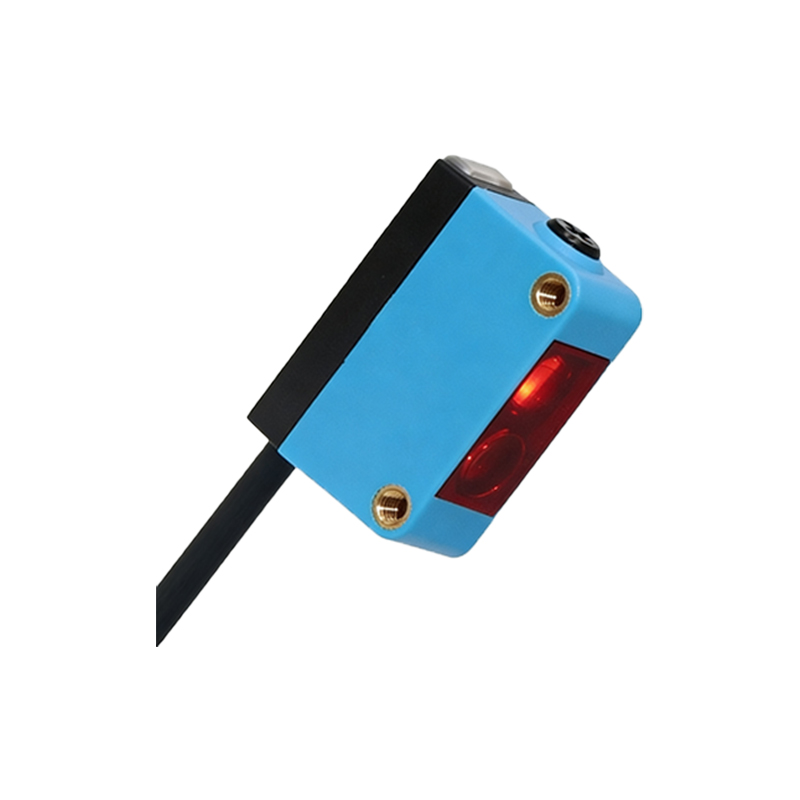
High-quality images of potential-type photoelectric sensors often highlight essential components: the emitter (LED or laser diode), the receiver (photodiode or phototransistor), the lens system, and the signal conditioning circuitry. In potential-type sensors, the output stage includes a voltage amplifier that linearizes the photodiode current into a voltage range, such as 0-10V or 1-5V. Images should clearly show the sensor housing, mounting brackets, and connector types (e.g., M12, M8) to aid in mechanical design. Engineers should look for images that label these parts, as they facilitate quick identification during installation or troubleshooting.
Reading Wiring Diagrams from Images
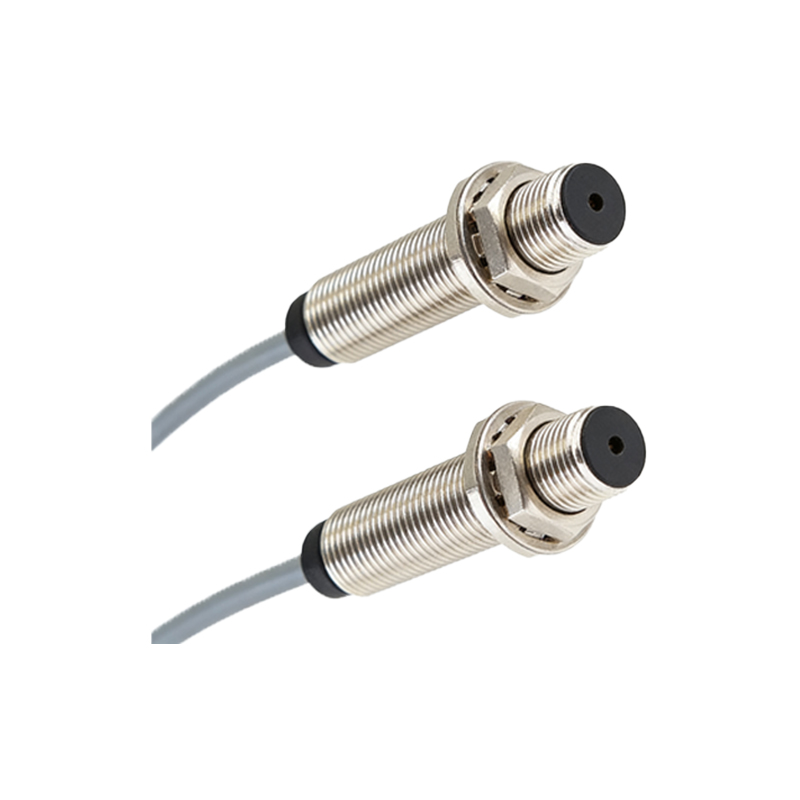
Potential-type sensor images often include wiring diagrams or pin assignments, which are essential for proper electrical integration. Typical wiring includes power supply pins (VCC and GND), output voltage pin (VOUT), and sometimes a control or test pin. In a 3-wire configuration, the output voltage varies linearly with the distance to the target or the intensity of reflected light. Engineers should verify that images clearly indicate the voltage range, load impedance (e.g., minimum 10kΩ), and protection features like reverse polarity or short-circuit protection. Correct interpretation of these diagrams prevents wiring errors that can damage the sensor or connected equipment.
Application-Specific Image Examples
Images that demonstrate real-world applications are invaluable. For instance, a potential-type sensor detecting transparent objects in a bottling line can be shown with a focused light beam and a voltage waveform on an oscilloscope. Another common example is distance measurement in conveyor systems, where the sensor image includes a target at varying distances and the corresponding output voltage curve. These images help engineers evaluate sensor performance, such as response time (typically<1ms), linearity error (<1%), and ambient light immunity. Always choose images that match your specific operating environment, such as dusty or wet conditions, to ensure reliable operation.
Common Installation and Alignment Issues in Images
Poor alignment is a frequent cause of sensor malfunction. Images that illustrate correct optical alignment, such as the emitter beam squarely hitting the receiver or a reflective target, are crucial for setup. In potential-type sensors, misalignment can cause voltage output to drift or saturate. Look for images that show the sensor’s detection zone, field of view, and recommended mounting distances. Additionally, images depicting electromagnetic interference (EMI) shielding or cable routing best practices can guide engineers in reducing noise on the voltage output line. These visuals save time during commissioning and reduce false triggers.
Interpreting Output Characteristics from Images
Graphical images showing the sensor’s output voltage versus distance or reflectivity are essential for calibration and fault diagnosis. For example, a typical curve may show a linear region from 0 to 20 cm, followed by saturation at 10V. Engineers can use these images to set threshold voltages, hysteresis, or to select the optimal sensor model for a given range. Always cross-reference these characteristics with the datasheet to ensure compatibility with your control system’s input range. High-resolution images with clear axis labels and units (e.g., V vs. mm) are preferred for accurate analysis.
Conclusion and Practical Tips for Engineers
When selecting or using potential-type photoelectric sensor images, prioritize clear, annotated visuals that cover wiring, mounting, and output characteristics. Always verify that the image corresponds to the exact model number, as variations in output voltage range or response time exist. For troubleshooting, use images that show typical fault signals, such as a noisy output or an open-circuit condition. By integrating these visual references into your engineering workflow, you can reduce installation errors, improve system reliability, and ensure optimal performance in automated environments.