1. Experiment Objective
The primary objective of this experiment is to evaluate the performance and accuracy of a photoelectric sensor in measuring distance and detecting object presence under various environmental conditions. This report focuses on the sensor's response time, linearity, and reliability in industrial automation applications.
2. Experimental Setup and Equipment
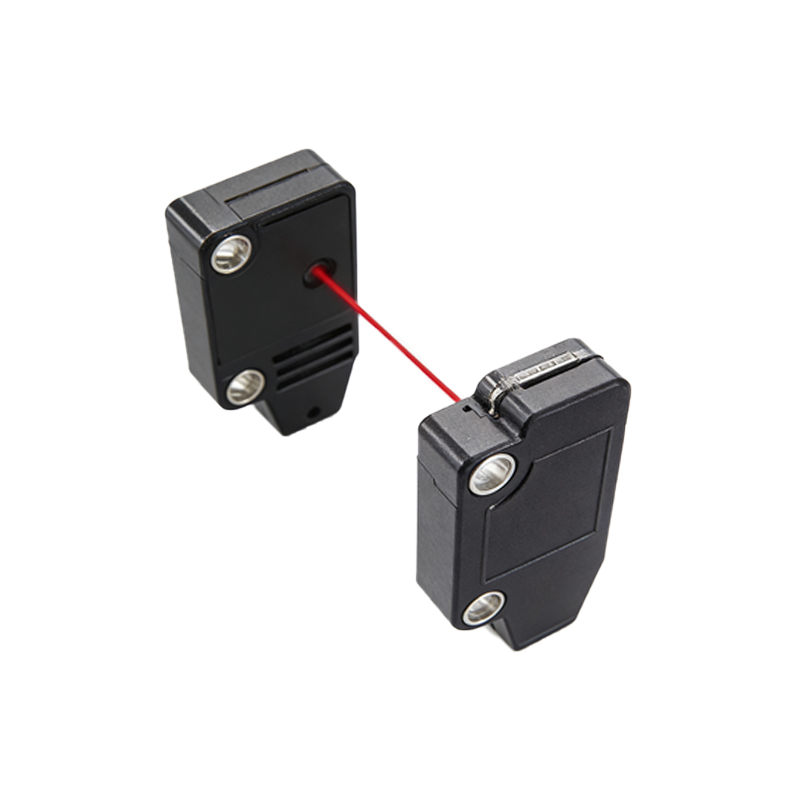
The experiment utilized a standard photoelectric sensor model OMRON E3X-NA11, coupled with a reflective target plate. The sensor was connected to a data acquisition system (DAQ) with a sampling rate of 1 kHz. A calibrated linear stage with a resolution of 0.01 mm was used to vary the distance between the sensor and the target. Environmental factors such as ambient light intensity and temperature were monitored using a lux meter and a thermocouple.
3. Measurement Procedure
The sensor was mounted on a fixed bracket, and the target was moved incrementally from 0 to 500 mm in steps of 10 mm. At each position, the sensor's output voltage was recorded over 100 samples to calculate the mean and standard deviation. The experiment was repeated three times under different ambient light conditions: 100 lux (indoor), 500 lux (bright office), and 1000 lux (near window). Temperature was maintained at 25°C ± 1°C.
4. Data Analysis and Results
The collected data showed a linear relationship between distance and output voltage within the range of 50 mm to 450 mm, with a correlation coefficient (R²) of 0.997. Beyond 450 mm, the output signal became non-linear due to reduced reflectivity and beam divergence. The sensor's response time was measured as 2.5 ms for a step change in distance, which is within the manufacturer's specification. Under varying ambient light, the output voltage varied by less than 2% at 500 lux, but increased to 5% at 1000 lux, indicating susceptibility to high ambient light.
5. Error Analysis and Calibration
Systematic errors were primarily due to sensor misalignment and target surface imperfections. Random errors were quantified by the standard deviation, which averaged 0.8 mV across all measurements. To improve accuracy, a calibration curve was fitted using a polynomial regression model: V (mV) = 0.45 × D (mm) + 12.3, with a residual error of ±1.5 mV. This calibration reduces the measurement uncertainty to ±3.3 mm.
6. Discussion and Industrial Implications
The photoelectric sensor demonstrates high linearity and fast response, making it suitable for conveyor belt monitoring, object counting, and positioning tasks in automated manufacturing. However, its performance degrades under intense ambient light, necessitating the use of filters or shielded enclosures in outdoor or high-light environments. Future improvements could include adaptive gain control or differential sensing to mitigate light interference.
7. Conclusion
This experiment confirms the photoelectric sensor's reliability for distance measurement up to 450 mm under controlled conditions. The calibration equation provides a practical tool for real-time integration. For industrial deployment, environmental shielding and periodic recalibration are recommended to maintain accuracy.