Introduction to Photoelectric Sensor Diagrams
Photoelectric sensors are critical components in industrial automation, used for detecting objects, distances, and material presence through light emission and reception. As an electrical engineer, mastering the drawing of these diagrams is essential for both design and troubleshooting. A typical photoelectric sensor diagram includes a power source, a light emitter (LED or laser), a receiver (phototransistor or photodiode), and output circuitry. The diagram must clearly represent the signal flow and wiring connections, often using standardized symbols from IEC or NEMA standards. For instance, the emitter is usually depicted as a triangle with a line indicating light direction, while the receiver is shown as a phototransistor symbol with a B (base), C (collector), and E (emitter) notation. Understanding these symbols ensures accurate representation in schematics and facilitates communication with technicians and other engineers.
Key Components and Their Symbols
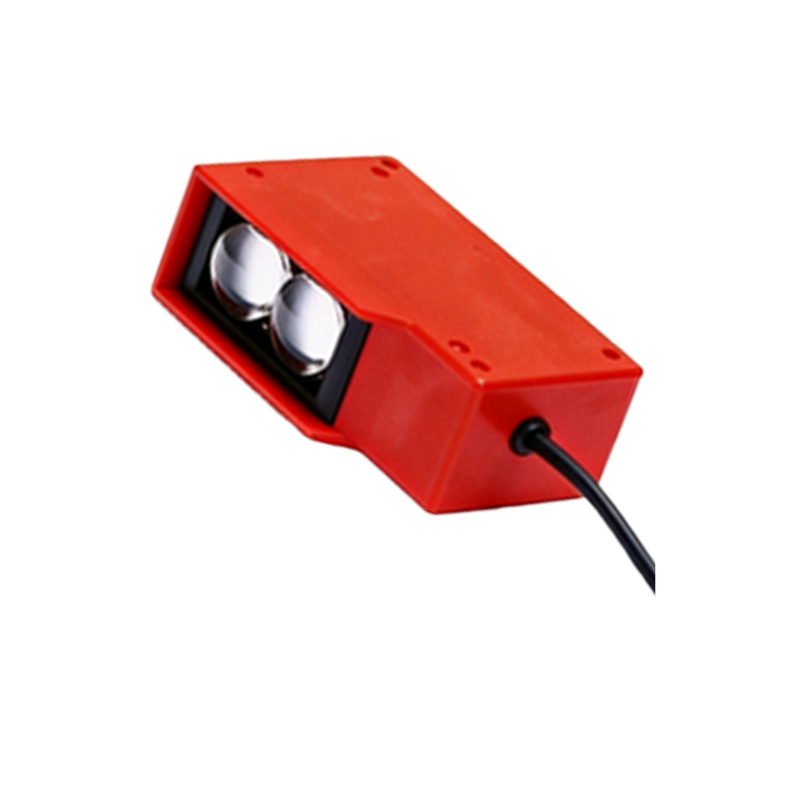
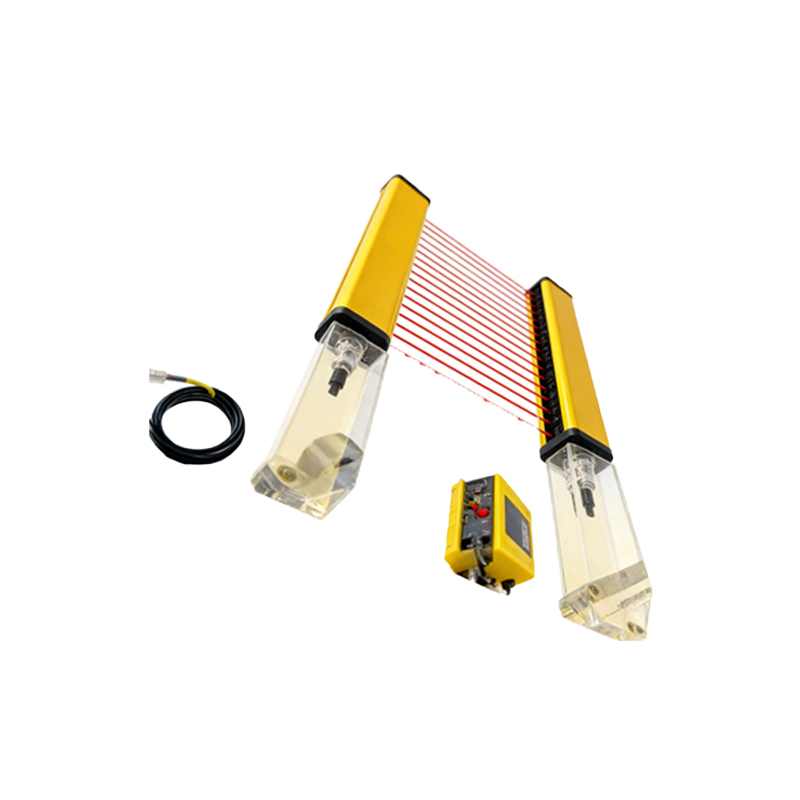
When drawing a photoelectric sensor diagram, start by identifying the sensor type: through-beam, retro-reflective, or diffuse. For through-beam sensors, the emitter and receiver are separate units, so the diagram must show two distinct blocks with a dashed line representing the light beam between them. Use a circle with a cross for the emitter and a square with a triangle for the receiver. For retro-reflective sensors, include a reflector symbol (a rectangle with diagonal lines) and ensure the emitter and receiver are in the same housing. Diffuse sensors require a single block with a rounded front to indicate the sensing face. Power supply connections are crucial: use +V and 0V terminals, often labeled as VCC and GND. Outputs (NPN or PNP) should be drawn with collector and emitter lines connected to load resistors or PLC inputs. For clarity, always include a note about the sensor’s operating voltage, typically 10-30V DC.
Step-by-Step Drawing Process
Begin your diagram with a title block including the sensor model, date, and engineer name. Place the sensor symbol in the center, using a rectangle for the housing. Draw the emitter circuit on the left: connect a current-limiting resistor (R1) in series with the LED, and link to the power supply. On the right, illustrate the receiver circuit: a phototransistor biased with a pull-up resistor (R2) to VCC, with its collector output going to a PLC input pin. For a through-beam configuration, add a separate receiver block with its own power and output wiring. Use standard electrical line conventions: solid lines for power wires, dashed lines for signals, and dotted lines for optical paths. Label each wire with color codes (e.g., brown for VCC, blue for GND, black for output) per IEC 60947-5-2. Finally, include a legend explaining all symbols and abbreviations used. This systematic approach reduces errors and improves readability.
Common Mistakes and Troubleshooting Tips
A frequent error in photoelectric sensor diagrams is misrepresenting the output type. NPN outputs sink current, so the load should connect between the output and VCC; PNP outputs source current, requiring the load between output and GND. Check polarity: reversed power connections can damage the sensor. Another oversight is ignoring ambient light filters; include a note about using modulated light to prevent false triggers. For wiring, avoid long cable runs exceeding the sensor’s specified length (e.g., 100 meters for some models) to prevent voltage drops. Always verify the diagram against the manufacturer’s datasheet, especially for special features like teach-in inputs or alarm outputs. If the sensor fails to operate in simulation, trace the optical path: ensure no obstructions between emitter and receiver, and confirm the reflector alignment for retro-reflective types. Documenting these checks in the diagram’s notes can save time during commissioning.
Advanced Considerations in Diagram Design
For complex systems, integrate multiple sensors into a network diagram using bus protocols like IO-Link or AS-Interface. In such cases, replace the simple output line with a communication bus symbol (e.g., a pair of parallel lines labeled “IO-Link”). Include a master controller block that aggregates sensor data. Also, account for environmental factors: if the sensor is used in dusty or wet conditions, specify IP ratings (e.g., IP67) in the diagram. For high-speed applications, note the sensor’s response time (e.g., 1 ms) to ensure compatibility with the PLC cycle time. Use a timing diagram alongside the schematic to illustrate the relationship between light pulses and output transitions. This level of detail makes the drawing a comprehensive engineering document, suitable for review in design meetings or for handoff to manufacturing teams.