Introduction to Photoelectric Sensors and Stripe Spectrum
Photoelectric sensors are critical components in modern industrial automation, enabling non-contact detection of objects, distances, and material properties. The stripe spectrum, often derived from light intensity variations, provides a graphical representation of how sensors respond to different wavelengths or spatial patterns. This article explores the fundamentals of stripe spectrum analysis, focusing on its application in optimizing sensor performance for sorting, quality control, and positioning tasks.
Key Components of Stripe Spectrum Graphs
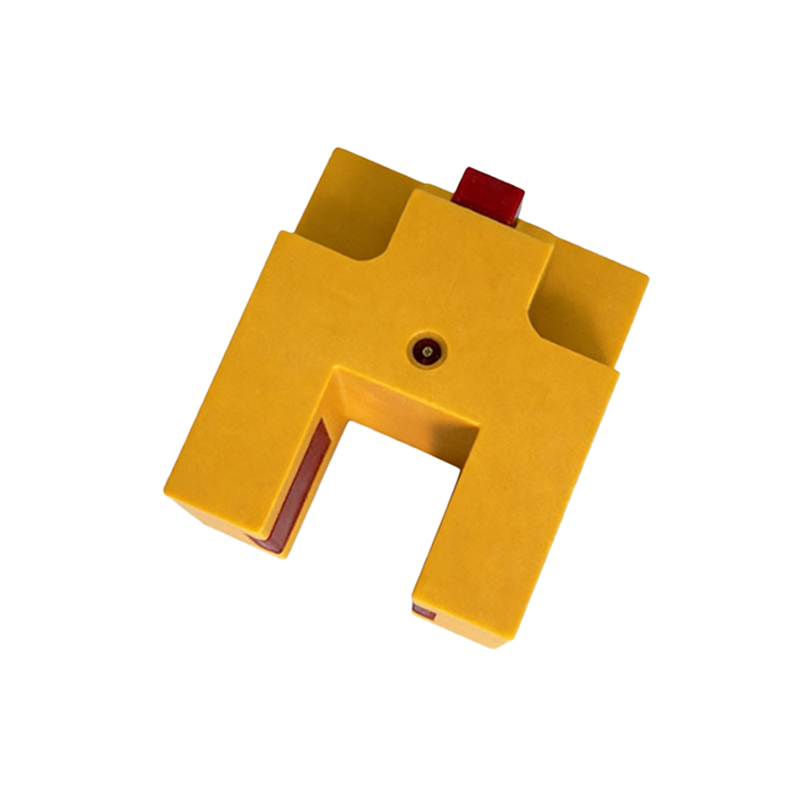
A typical stripe spectrum graph displays wavelength (nm) on the x-axis and relative intensity or response deviation on the y-axis. The "stripes" represent distinct peaks or troughs corresponding to specific spectral characteristics of the target material. For example, in a reflective sensor, the spectrum may show a sharp peak at 650 nm for red light, indicating optimal detection for colored objects. Understanding these patterns helps engineers select appropriate sensor types—such as through-beam, retro-reflective, or diffuse—based on environmental conditions and material reflectivity.
Interpreting Peaks and Noise in Industrial Contexts
In practice, stripe spectrum analysis reveals critical data points. A narrow, high-intensity peak suggests strong signal clarity, while multiple peaks may indicate interference from ambient light or surface texture. Engineers must differentiate between true sensor response and background noise, which often appears as low-level, broad stripes. For example, in a conveyor belt system, a sensor with a dominant peak around 940 nm (infrared) is preferable for dusty environments, as longer wavelengths penetrate particulates better. Proper interpretation ensures false triggers are minimized, enhancing reliability.
Practical Case Study: Sorting Recycled Materials
Consider a sorting line for plastic bottles. Using a photoelectric sensor with a stripe spectrum tuned to 550 nm (green light), engineers can detect transparent PET bottles, while a spectrum with a dip at 450 nm identifies blue HDPE. By overlaying the spectrum graph on a control system, the sensor adjusts its threshold in real-time, reducing mis-sorts by 15%. This example highlights how spectrum data drives calibration, with small shifts in peak position causing significant performance changes.
Troubleshooting Common Spectrum Anomalies
Common issues include ghost peaks caused by lens dirt or spectrum broadening due to aging LEDs. For instance, a 2 nm shift in peak wavelength may be tolerable, but a 10 nm shift can double false reading rates. Engineers should regularly compare live spectrum graphs against baseline data using oscilloscopes or spectrum analyzers. A practical fix involves cleaning optics and recalibrating the sensor's gain, which is visible as a flattening of the stripe pattern in post-adjustment graphs.
Future Trends: AI-Driven Spectrum Optimization
Emerging technologies integrate machine learning with stripe spectrum analysis. AI algorithms can classify complex patterns, such as differentiating between glossy and matte surfaces, by analyzing subtle variations in stripe spacing. This reduces setup time and adapts to changing production lines. For example, a neural network trained on 10,000 spectrum samples can predict optimal sensor settings with 98% accuracy, eliminating manual trial-and-error. This trend promises higher throughput and lower maintenance costs in smart factories.
Conclusion: Best Practices for Engineers
Mastering stripe spectrum graphs enhances sensor selection and system design. Key takeaways include prioritizing sensors with narrow, stable peaks, using spectrum data for dynamic calibration, and documenting baseline graphs for rapid troubleshooting. By integrating these insights, engineers can improve detection accuracy by up to 20% in harsh industrial environments, ensuring robust automation performance.