A laser methane sensor represents a significant advancement in gas detection technology, offering high precision, reliability, and real-time monitoring capabilities. At its core, the sensor operates based on the principle of tunable diode laser absorption spectroscopy (TDLAS). This method leverages the unique absorption characteristics of methane molecules at specific infrared wavelengths. By analyzing how laser light is absorbed as it passes through a gas sample, the sensor can accurately determine methane concentration. Understanding the block diagram of such a sensor is crucial for engineers, technicians, and safety professionals involved in industrial, environmental, or residential applications.
The block diagram of a laser methane sensor typically consists of several key components that work together seamlessly. First, the laser source emits a narrow-band infrared beam tuned to a wavelength where methane absorbs strongly, often around 1653 nanometers. This laser is precisely controlled by a driver circuit that adjusts its temperature and current to maintain stability and accuracy. The emitted light then travels through a collimator, which shapes the beam to ensure it remains focused over long distances, enhancing the sensor's ability to detect methane leaks from afar.
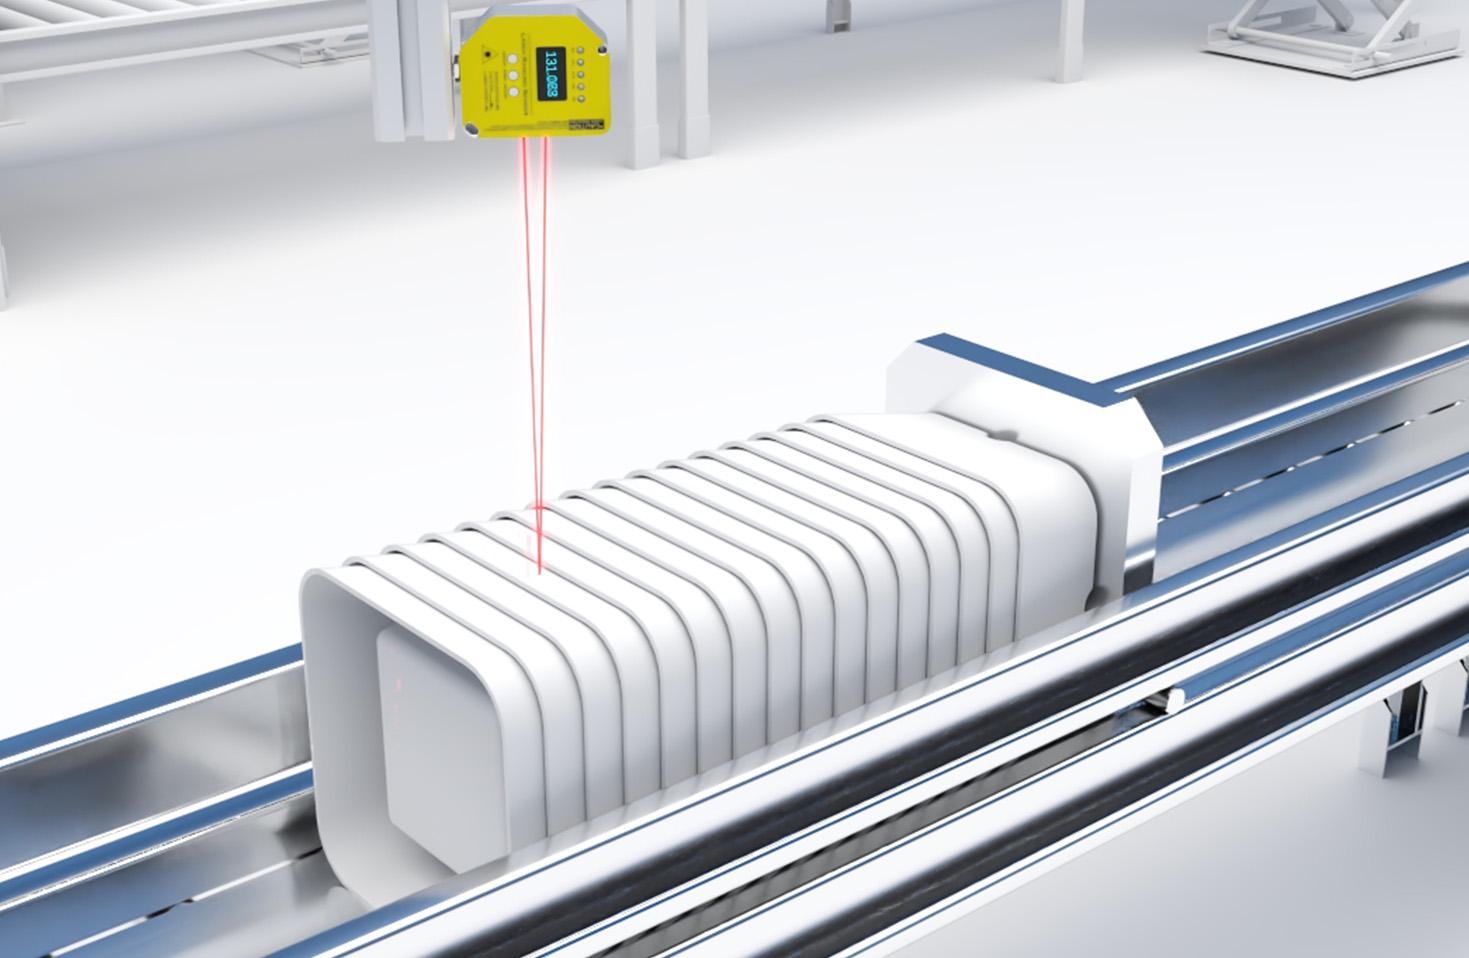
Next, the beam passes through the measurement path, which could be an open path for remote sensing or a sample cell for direct analysis. In open-path configurations, the laser beam is directed across an area, such as a pipeline or storage facility, and reflected back by a retroreflector. For in-situ measurements, the gas sample is drawn into a chamber where the laser interacts with it. As methane molecules absorb some of the laser light, the intensity of the beam decreases proportionally to the gas concentration. This attenuated light then reaches a photodetector, which converts the optical signal into an electrical one.
The photodetector's output is fed into a signal processing unit, a critical part of the block diagram. Here, advanced algorithms analyze the absorption data, compensating for environmental factors like temperature, pressure, and interference from other gases. The processing unit often includes a microcontroller or digital signal processor (DSP) that performs real-time calculations, ensuring high sensitivity and low false-alarm rates. Additionally, calibration modules are integrated to maintain long-term accuracy, with some sensors featuring automatic self-calibration routines.
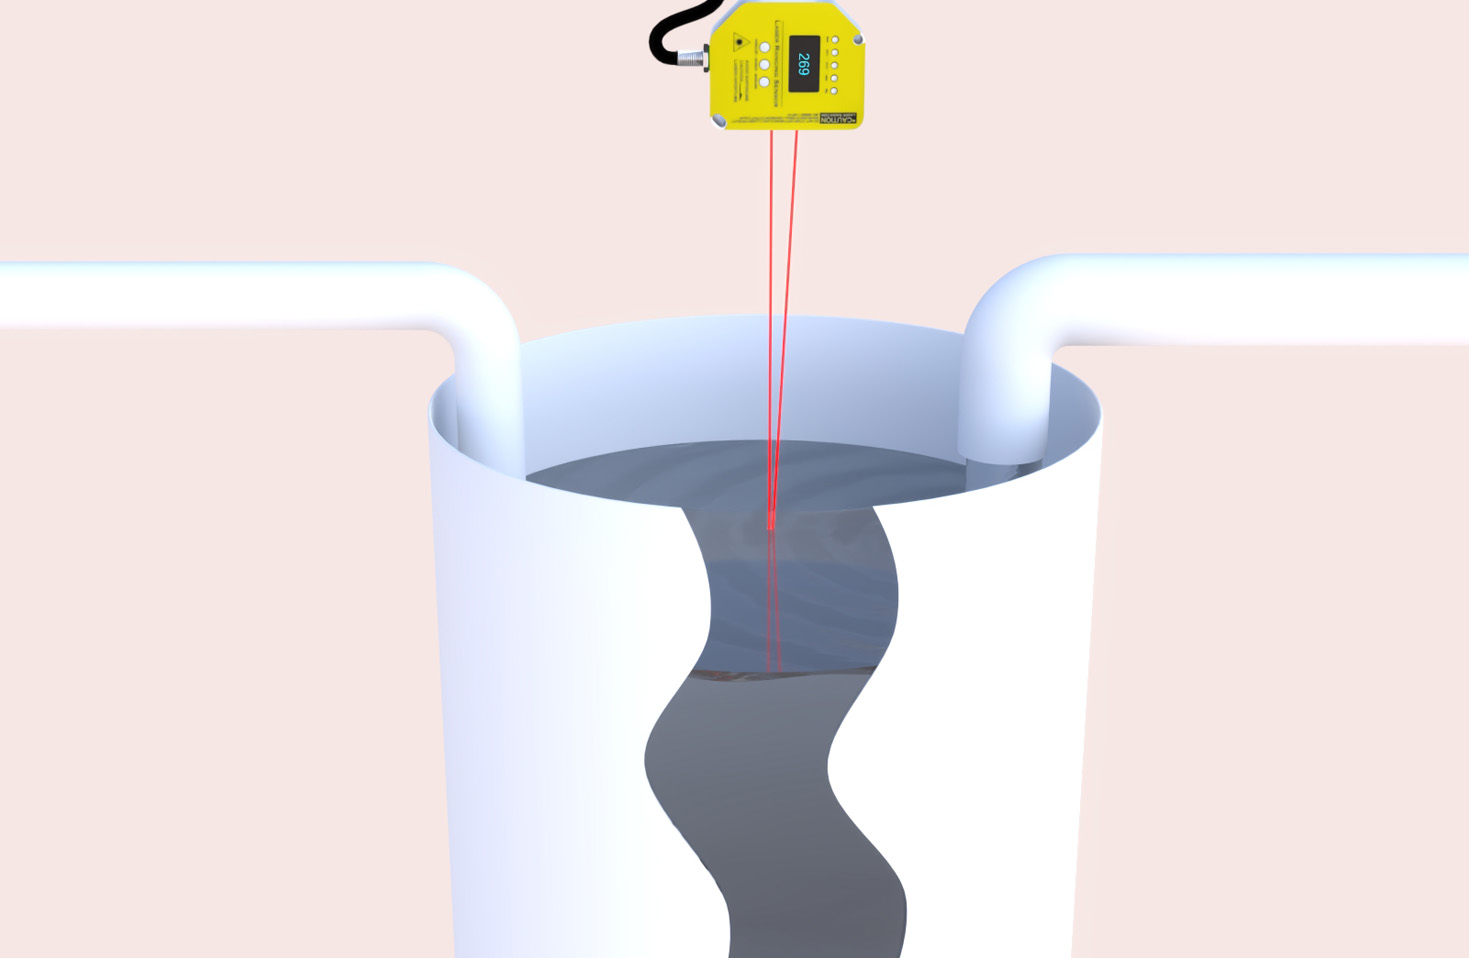
Power management is another essential component, as laser methane sensors are frequently deployed in remote or hazardous locations. The block diagram includes a power supply unit that may support various sources, such as batteries, solar panels, or grid connections, along with low-power modes to extend operational life. Communication interfaces, like 4G, Wi-Fi, or RS-485, enable data transmission to control systems or cloud platforms, allowing for continuous monitoring and alerts. Finally, the sensor's housing is designed to be robust, often meeting IP67 or explosion-proof standards for durability in harsh environments.
In practice, laser methane sensors are widely used in industries such as oil and gas, wastewater treatment, and mining, where methane leaks pose safety and environmental risks. Their block diagram reflects a balance of optical, electronic, and software engineering, resulting in devices that are both highly effective and user-friendly. By grasping this diagram, stakeholders can better appreciate the technology's inner workings, facilitating installation, maintenance, and troubleshooting. As methane detection needs grow, driven by regulatory requirements and sustainability goals, these sensors will continue to evolve, with block diagrams incorporating innovations like IoT connectivity and AI-driven analytics for smarter gas monitoring solutions.