Introduction to Photoelectric Sensor Testing
Photoelectric sensors are critical components in industrial automation, used for detecting objects, distances, and presence. Ensuring their reliability requires rigorous testing, which is often manual and time-consuming. This article presents an automated test fixture designed to streamline the validation process, improving efficiency and accuracy in quality assurance.
Key Challenges in Manual Testing
Manual testing of photoelectric sensors involves repetitive alignment, varying light conditions, and subjective judgment. Operators face fatigue, leading to inconsistent results. For instance, testing response time under different reflectivities or ambient light requires precision that manual setups cannot guarantee. This fixture addresses these limitations by integrating automated positioning and data acquisition.
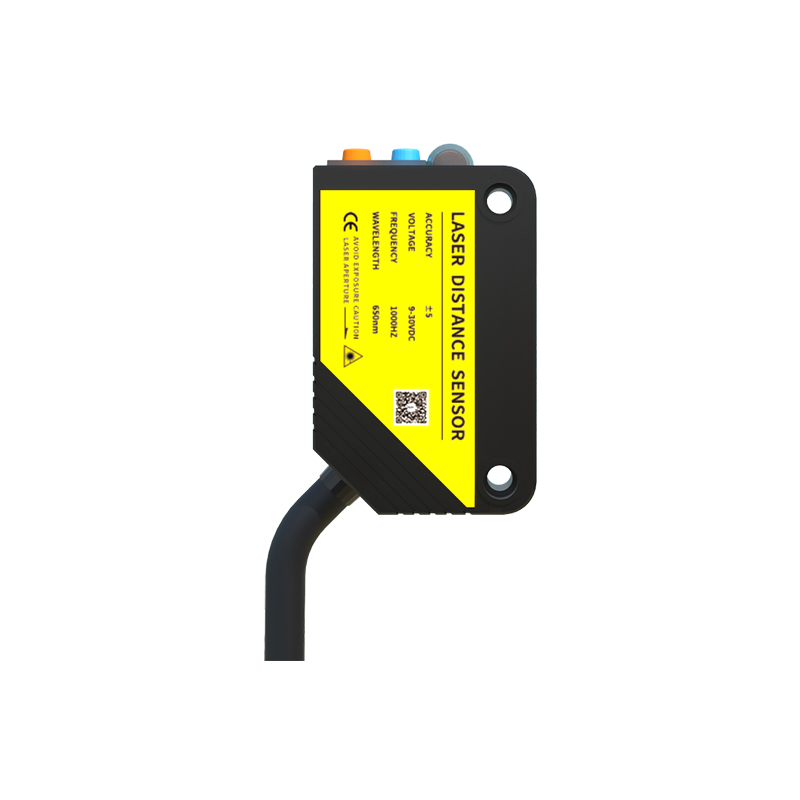
Design Specifications of the Fixture
The fixture is built on a modular aluminum frame with a stepper motor-driven XY stage for precise sensor alignment. It includes a programmable LED light source to simulate ambient conditions, a target reflector with adjustable distance, and a 24V DC power supply. All components are controlled via a PLC (Programmable Logic Controller) with a touchscreen HMI (Human-Machine Interface). Key specifications include a positioning accuracy of ±0.1 mm and test cycle time under 2 seconds per sensor.
Automated Test Procedures
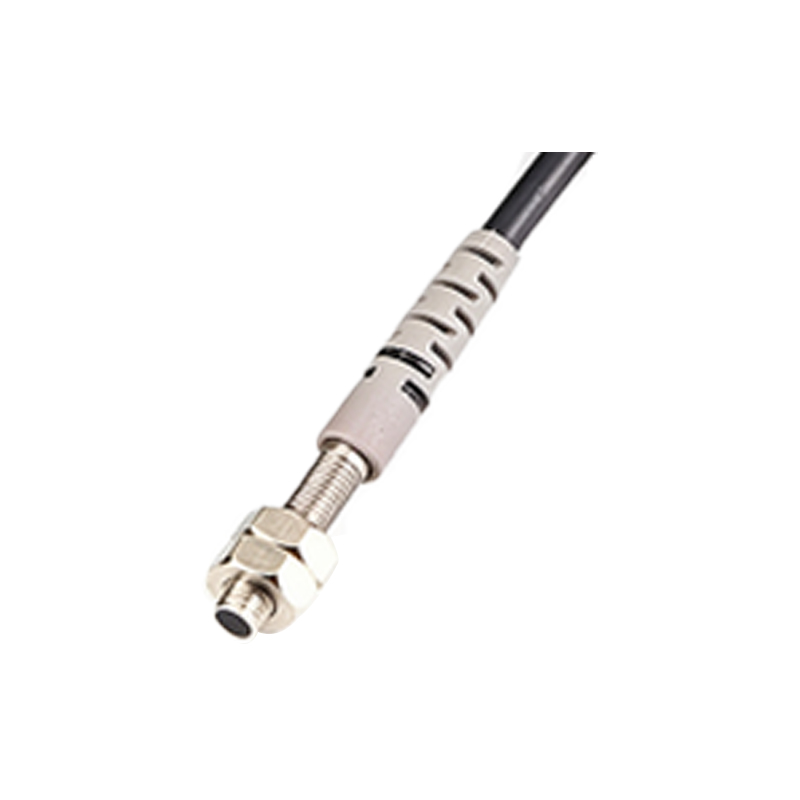
The fixture executes a pre-defined sequence: first, it calibrates the sensor’s baseline output under dark conditions. Next, it tests detection range by moving the target from 0 to 10 meters at 0.5 m increments. For each step, it records the sensor’s digital output (ON/OFF) and analog signal strength. Then, it evaluates response time using a high-speed camera triggered by the sensor’s activation. Finally, it performs a hysteresis check by approaching and receding the target.
Data Acquisition and Analysis
Data is logged via a USB-connected DAQ (Data Acquisition) module to a PC running custom LabVIEW software. The system captures 1000 samples per test for statistical analysis. Results are displayed in real-time on the HMI, showing pass/fail criteria based on industry standards (e.g., IEC 60947-5-2). For instance, a sensor must have a response time below 1 ms and a detection range within 5% of specified value. The software generates a test report in PDF format, including graphs of signal strength vs. distance.
Performance Evaluation and Results
In field trials with 500 photoelectric sensors, the fixture reduced testing time by 60% compared to manual methods. False reject rates dropped from 3% to 0.5% due to consistent alignment. Repeatability tests showed a coefficient of variation below 1% for response time measurements. However, challenges arose with sensors requiring specific lens orientations, which required additional calibration steps in the software.
Conclusion and Future Improvements
The automated test fixture significantly enhances throughput and reliability in photoelectric sensor testing. Future upgrades could include machine vision for automated lens alignment and wireless data transmission to a central database. Additionally, integrating AI-based anomaly detection could predict sensor failures during production.