Introduction to Photoelectric Sensor Testing
Photoelectric sensors are fundamental components in modern industrial automation, serving critical roles in object detection, positioning, and quality control. Their operation, based on the modulation of light beams, requires precise calibration and rigorous data analysis to ensure reliability in diverse environmental conditions. This guide delves into the methodologies for analyzing experimental data from photoelectric sensors, focusing on key performance metrics such as response time, sensing distance accuracy, and environmental interference. Engineers must approach this data not as isolated numbers but as a narrative describing the sensor's interaction with its operational world. A systematic analysis protocol is essential for validating sensor specifications, troubleshooting application issues, and optimizing system integration for maximum efficiency and uptime.
Establishing the Experimental Framework
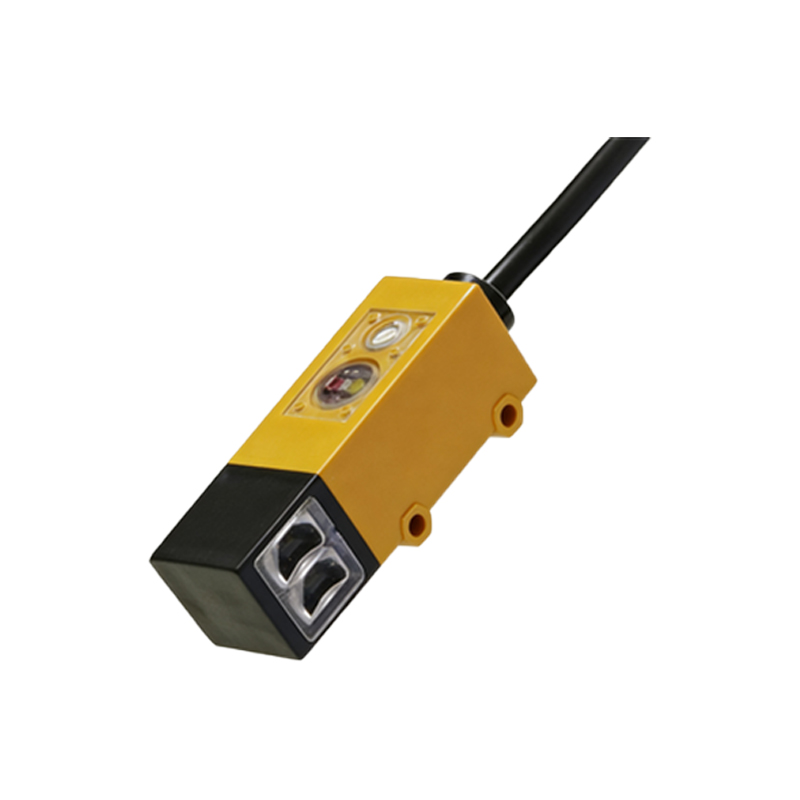
Before data collection begins, a robust experimental framework must be established. This involves defining clear test parameters: the target object's properties (reflectivity, color, size, material), the ambient lighting conditions, and the required sensing mode (diffuse, retro-reflective, or through-beam). The test setup should replicate, as closely as possible, the sensor's intended real-world application. Data logging equipment with sufficient sampling rates—often in the kilohertz range—is necessary to capture transient events like fast-moving objects or electrical noise. Calibration of all measurement instruments, including oscilloscopes, multimeters, and distance gauges, is a non-negotiable first step. Documenting this framework in detail ensures the experimental data's reproducibility and validity, forming the foundation for all subsequent analysis.
Key Data Metrics and Their Significance
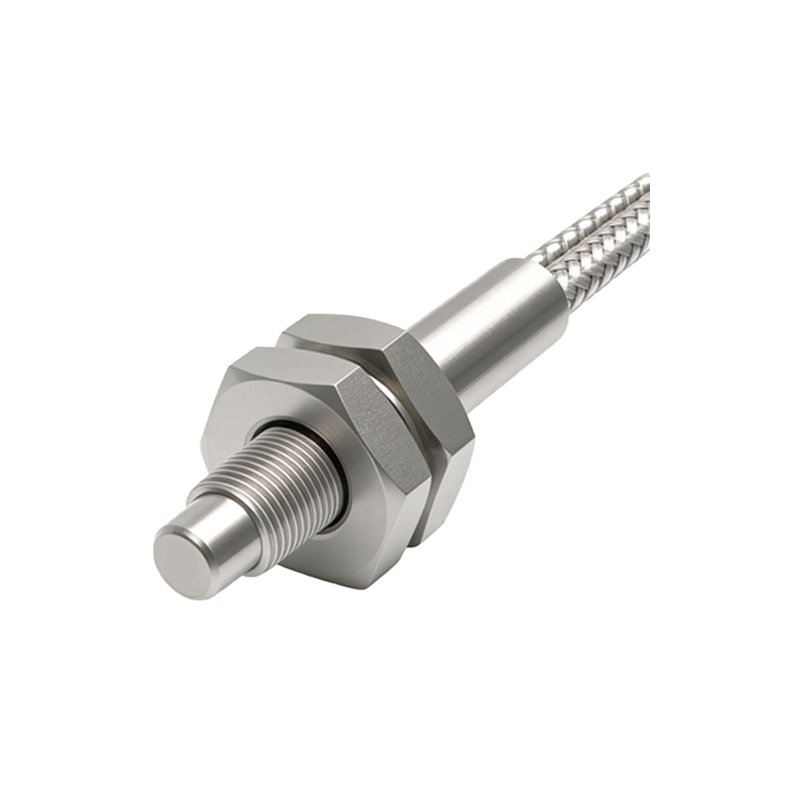
The core of the analysis revolves around several critical data sets. First is the *Response Time Curve*, plotting the sensor's output signal against time following a detection event. Analysis here reveals rise/fall times and potential signal overshoot or oscillation. Second is the *Sensing Distance Characteristic*, which graphs the reliable detection range against target reflectivity. This curve identifies the effective operating window and highlights drop-off points. Third is *Environmental Stability Data*, recording performance shifts under variable temperature, humidity, and ambient light (e.g., sunlight, strobe lights). Statistical analysis of repeated measurements under these conditions provides metrics like mean detection distance, standard deviation, and repeatability error. Each dataset tells a part of the sensor's performance story.
Analyzing Response Time and Signal Integrity
Oscilloscope captures of the sensor's output are paramount. Engineers must scrutinize the waveform for clean transitions between logical high and low states. Excessive rise time can cause missed detections on high-speed lines, while ringing or noise on the signal plateau may lead to false triggers. Calculating the 10% to 90% rise time and 90% to 10% fall time from the data is standard. Furthermore, one must analyze the sensor's response delay (the time from the light beam's interruption to the output signal change). Comparing this experimental delay to the datasheet specification is crucial. Any discrepancy or instability in these time-domain metrics often points to issues with the sensor's internal circuitry, power supply noise, or inadequate shielding from electromagnetic interference (EMI).
Interpreting Sensing Distance and Hysteresis
Experimental data for sensing distance typically reveals a non-linear relationship. For diffuse sensors, the detected signal strength decreases with the square of the distance. The analysis involves determining the *assured operating distance*, where detection is 100% reliable under defined conditions. A key finding is often *hysteresis*—the difference between the "turn-on" point (as the target approaches) and the "turn-off" point (as it recedes). This hysteresis, expressed as a percentage of the sensing distance, is a designed feature to prevent output chatter but must be quantified. Data plots should clearly show this band. Analysis must also confirm that the sensor does not exhibit "blind zones" at certain distances and that the detection is consistent across the target's surface area.
Quantifying Environmental and Noise Impact
No sensor operates in an ideal environment. Data from tests under high ambient light, temperature cycles, and electrical noise injection must be rigorously analyzed. For instance, plotting detection failure rate against ambient lux levels identifies the sensor's optical robustness. Temperature drift data, showing changes in sensing distance or output current across an operating range (e.g., -25°C to 70°C), requires regression analysis to model the drift coefficient. Electrical noise susceptibility tests, where common-mode noise is introduced on the supply lines, generate data on output glitches or resets. Statistical process control (SPC) charts can be effectively used here to distinguish common-cause variation from special-cause failures, guiding decisions on necessary shielding, filtering, or sensor selection.
Statistical Methods for Data Validation
Raw data requires statistical treatment to draw reliable conclusions. Engineers should employ tools like hypothesis testing to compare experimental mean performance against claimed specifications. Calculating confidence intervals for key parameters (e.g., "with 95% confidence, the response time is between 0.98ms and 1.02ms") provides a range of expected performance. Analysis of Variance (ANOVA) can be used when testing multiple sensors from the same batch or different models under the same conditions to identify significant performance differences. Correlation analysis helps quantify the relationship between variables, such as how strongly sensing distance correlates with temperature. Presenting data with clear visualizations—histograms, box plots, and scatter charts with trend lines—is essential for communicating findings to cross-functional teams.
From Analysis to Application: Practical Recommendations
The ultimate goal of data analysis is to inform engineering decisions. The analyzed data should lead to clear, actionable recommendations. This may include specifying a derating factor for the sensor's published range (e.g., "use at 80% of max distance for this low-reflectivity target"), defining necessary environmental guards (e.g., "install a sun hood for outdoor applications"), or specifying required electrical filters. The analysis might also reveal that a different sensing mode or a sensor with a different light wavelength (e.g., laser vs. LED, red vs. infrared) is more suitable for the application. A final report should synthesize all data, summarizing the sensor's suitability for the task, its limitations, and the precise installation and operating parameters required for reliable, long-term operation.