Understanding Photoelectric Sensor Types
Photoelectric sensors are categorized based on their sensing methods: through-beam, retro-reflective, and diffuse-reflective. Through-beam sensors consist of separate emitter and receiver units, offering the longest detection range and highest reliability by detecting interruptions in the light beam. Retro-reflective sensors use a reflector to bounce light back to the receiver, providing a moderate detection range while requiring only one wiring point. Diffuse-reflective sensors detect objects by measuring the reflection of light from the target itself, making them ideal for close-range applications where space is limited. Each type has distinct advantages depending on environmental factors, target material, and installation constraints.
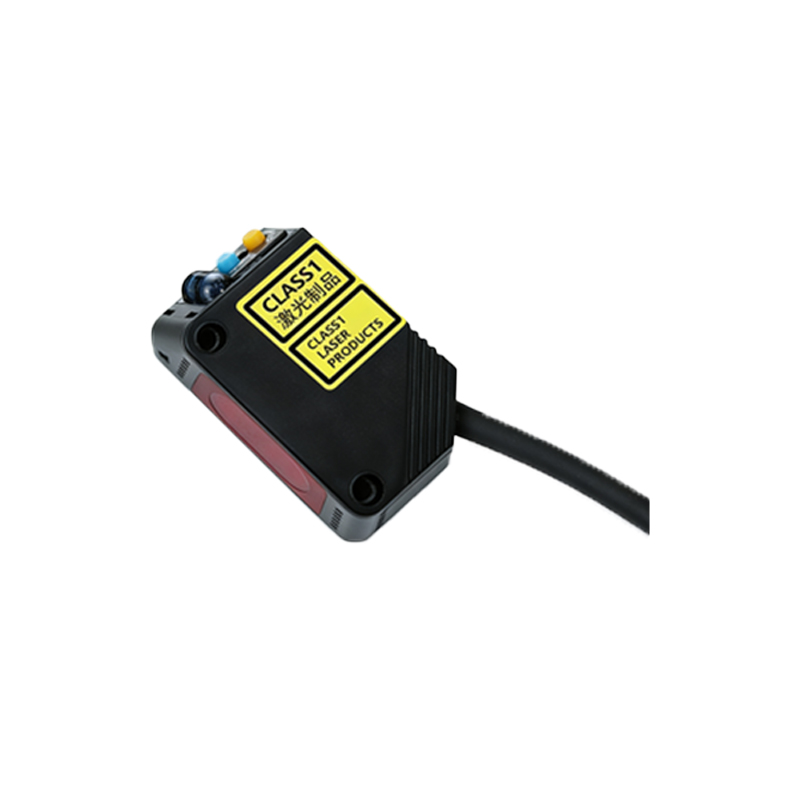
Key Parameters for Sensor Selection
Selecting the right photoelectric sensor involves evaluating several technical parameters. Sensing distance, response time, and light source type (e.g., red LED, infrared, laser) directly impact performance. Environmental conditions such as ambient light, dust, or moisture necessitate sensors with higher IP ratings or specialized housings. Output configurations (NPN/PNP, analog, or relay) must align with the control system’s requirements. Additionally, consider the target’s size, color, and surface texture, as these affect reflectivity and detection consistency. Charts illustrating parameter trade-offs can streamline decision-making.
Interpreting Selection Charts and Diagrams
Visual aids like selection charts simplify the comparison of sensor specifications. A typical chart plots sensing distance against beam dispersion, helping users identify models suitable for precise or broad-area detection. Diagrams showing beam patterns (e.g., spot, line, or wide-angle) clarify coverage areas. Another useful chart correlates response frequency with object size, aiding in high-speed application choices. By cross-referencing these visuals with operational needs, engineers can quickly narrow down options without delving into dense datasheets.
Environmental and Application Considerations
Industrial environments pose challenges like temperature extremes, vibration, or chemical exposure. Sensors with stainless steel housings or conformal coatings resist corrosion, while models with background suppression ignore interfering surfaces. In food processing or pharmaceutical settings, washdown-rated sensors prevent contamination. Application-specific diagrams, such as those depicting conveyor setups or robotic workcells, demonstrate optimal sensor placement to avoid false triggers. Always verify certifications (e.g., UL, CE) for compliance with regional safety standards.
Integration and Maintenance Tips
Proper integration ensures long-term reliability. Wiring diagrams highlight correct connections to PLCs or controllers, emphasizing polarity and shielding to prevent electrical noise. Alignment tools or built-in indicators simplify installation, reducing downtime. Maintenance charts recommend cleaning intervals for lenses and reflectors based on environmental dust levels. Additionally, diagnostic features like teach-in functions or IO-Link communication enable proactive adjustments. Keeping selection charts on hand facilitates quick replacements or upgrades during system expansions.