Introduction to Photoelectric Sensing Fundamentals
Photoelectric sensors are ubiquitous in industrial automation, providing non-contact detection of objects based on the modulation of a light beam. At the core of every photoelectric sensor lies its optical path—the engineered journey of light from emitter to receiver. Understanding the schematic representation of this path is crucial for engineers tasked with selecting, integrating, and troubleshooting these devices. The optical path schematic is not merely a diagram; it is a functional blueprint that dictates the sensor's operating principle, range, environmental robustness, and application suitability. This article delves into the components and configurations of standard optical path schematics, translating the symbols and lines into practical engineering knowledge.
Core Components: Emitter and Receiver
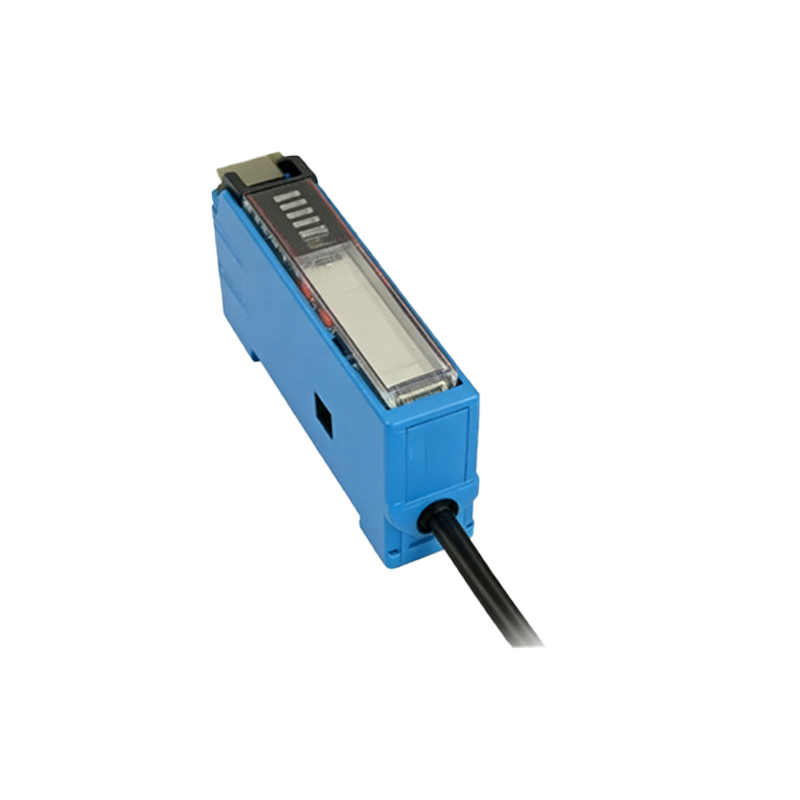
Every optical path begins with the emitter, typically a Light Emitting Diode (LED). In schematics, this is represented by a diode symbol often emitting conical rays. Common types include visible red, infrared, and laser LEDs, each chosen for specific range, precision, or visibility needs. The light is modulated at a specific frequency to allow the receiver to distinguish it from ambient light. Directly opposite in the schematic is the receiver, usually a phototransistor or photodiode. Its symbol resembles a standard transistor with light-sensitive arrows pointing inward. This component converts the incoming modulated light into a corresponding electrical signal. The schematic clearly shows the directional flow: from the electrical drive circuit to the emitter, through the optical medium, into the receiver, and back to the evaluation electronics.
The Through-Beam (Opposed) Configuration
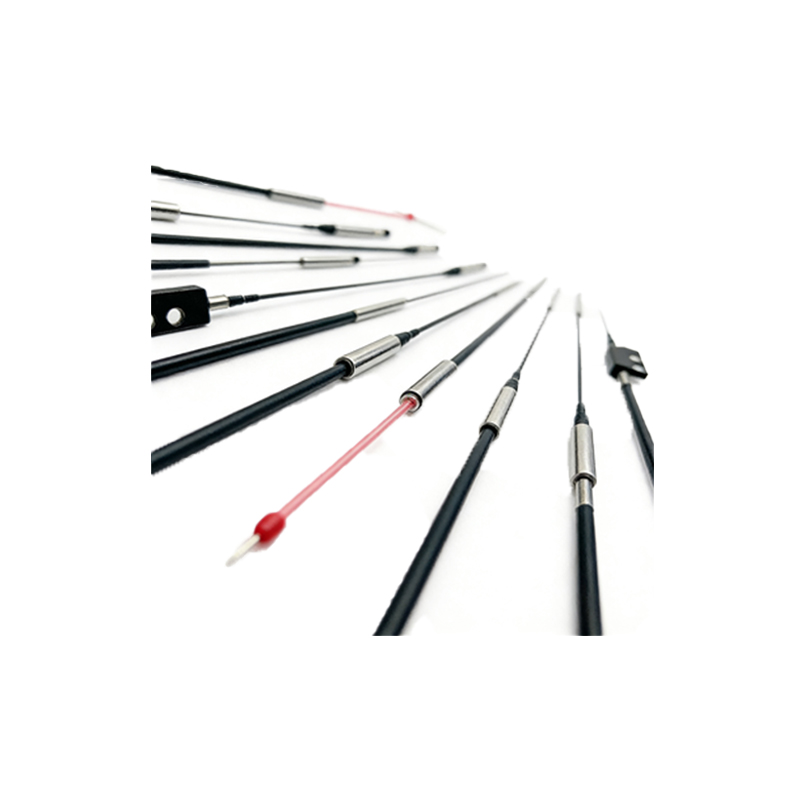
The through-beam, or opposed mode, schematic depicts the simplest and most robust optical path. The emitter and receiver are housed in separate units, facing each other directly. The schematic shows two distinct blocks connected by parallel dashed lines representing the light beam. Detection occurs when an object interrupts this beam. This configuration offers the longest sensing distances and highest excess gain, making it immune to object color, reflectivity, or surface angle. Engineers use this schematic to identify applications requiring high reliability over long ranges, such as object detection on large conveyor systems or break-to-make safety curtains.
The Retroreflective Configuration
In the retroreflective schematic, both emitter and receiver are located in the same housing. The diagram shows their lenses positioned closely together. The light path is drawn from the emitter to a distinct symbol representing a retroreflector (a prismatic or corner-cube reflector), and a return path back to the receiver. The reflector's symbol is key, often shown as a square with a triangular pattern. An object is detected when it blocks this round-trip beam. A crucial element shown in advanced schematics is the polarization filter, depicted as a grid over the lenses. This filter allows the sensor to ignore shiny objects that might otherwise reflect light directly back, mimicking the reflector's signal.
The Diffuse (Proximity) Configuration
The diffuse or proximity mode schematic is the most compact, showing emitter and receiver in one housing without an external reflector. The light path is drawn from the emitter to a target object and then a scattered (diffuse) return path to the receiver. This schematic often includes an angle between the emitted and received beams to illustrate the convergent or fixed-focus sensing field. Detection is based on the amount of light scattered back from the target. The schematic helps engineers understand the shorter range and sensitivity to target color, texture, and reflectivity. Variants like background suppression (BGS) or foreground suppression (FGS) have more complex schematics showing triangulation paths to define a precise cutoff plane.
Key Schematic Symbols and Annotations
Beyond the basic components, optical path schematics use standardized annotations. Lens icons indicate collimating or focusing optics that shape the beam. Arrows denote the direction of light propagation. Dashed lines versus solid lines may differentiate between infrared and visible light paths. Important performance parameters are often noted: the sensing range, beam spot size, and response time. For fiber optic sensors, the schematic bifurcates, showing the amplifier unit separately from the fiber optic cables, which are depicted as flexible lines connecting to the sensing head. Understanding these symbols allows for quick comparison of sensor capabilities directly from datasheet diagrams.
Environmental Factors in Path Design
A well-drawn schematic also implies design considerations for challenging environments. The path may show protective windows or coatings to resist dust and moisture. In schematics for sensors designed for harsh environments, the light path might be drawn with a "sealed" annotation. For applications with airborne contaminants like dust or mist, schematics for sensors with synchronous detection (modulated light) are critical, as they show how the electronics filter out slow-changing ambient light. Engineers must interpret these features to ensure the optical path remains reliable in the presence of optical obstructions, temperature variations, or vibrational misalignment.
Conclusion: From Schematic to System Integration
Interpreting a photoelectric sensor's optical path schematic is a fundamental skill. It moves the engineer from seeing a simple black box to understanding a precise optical-electrical system. By analyzing the emitter-receiver arrangement, the beam path geometry, and the ancillary symbols, one can predict performance, diagnose alignment issues, and select the optimal sensor for detection, positioning, or counting tasks. The schematic serves as the universal language between sensor manufacturers and automation engineers, ensuring that the invisible beam of light performs its critical role reliably within the larger control system.