Introduction to Proximity Sensor Distance Measurement
Proximity sensors are essential components in modern industrial automation, robotics, and safety systems, designed to detect the presence or absence of objects within a specified range without physical contact. The structural diagram of a proximity sensor for distance measurement provides a detailed visual representation of its internal components and their functional relationships. This diagram typically illustrates key elements such as the sensing element, oscillator, signal conditioning circuit, output stage, and housing. Understanding this structure is crucial for engineers to optimize sensor selection, installation, and maintenance in various applications, from manufacturing assembly lines to autonomous vehicles. The diagram serves as a blueprint, highlighting how each part contributes to accurate distance detection, ensuring reliable performance in diverse environments.
Key Components in the Structural Diagram
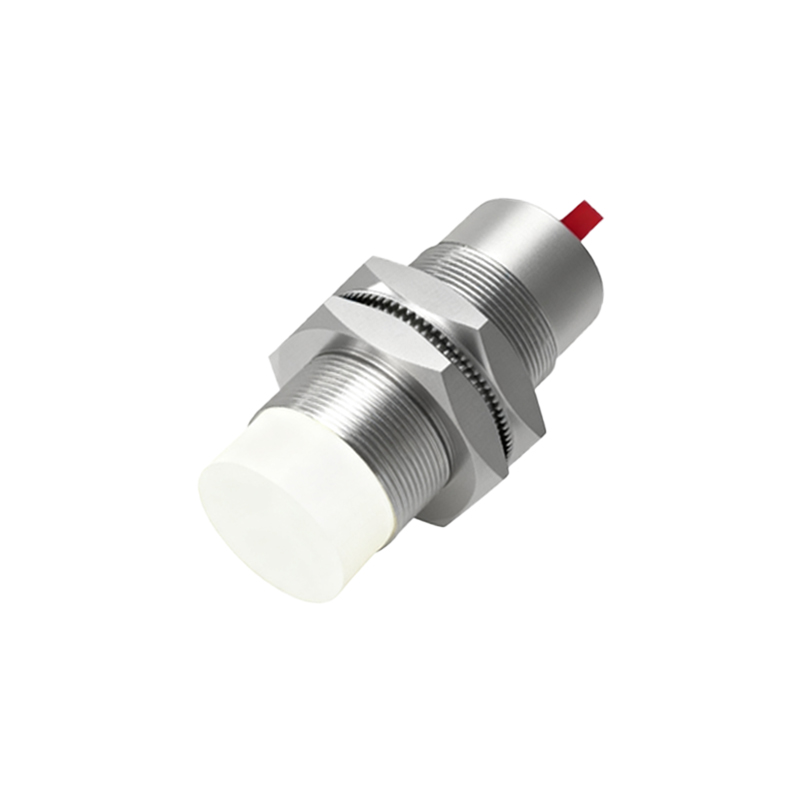
The structural diagram of a proximity sensor for distance measurement includes several core components. First, the sensing element, often an inductive coil, capacitive plate, or ultrasonic transducer, is responsible for emitting and receiving signals. This element interacts with the target object, with changes in the signal—such as amplitude or frequency—indicating distance. Next, the oscillator generates a high-frequency electromagnetic field or sound waves, which are modulated based on object proximity. The signal conditioning circuit processes the raw data from the sensing element, filtering noise and converting it into a usable electrical signal. Finally, the output stage, which may include analog or digital interfaces like 4-20mA, voltage outputs, or switching signals, transmits the distance information to control systems. The housing, made from materials like stainless steel or plastic, protects these internal parts from environmental factors like dust, moisture, and mechanical stress.
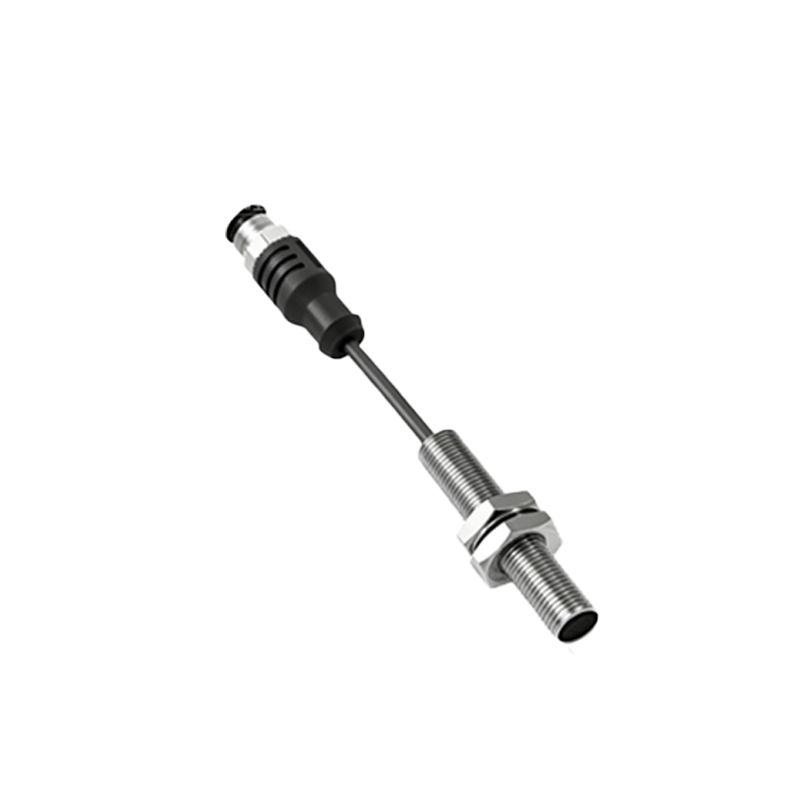
Working Principle Illustrated in the Diagram
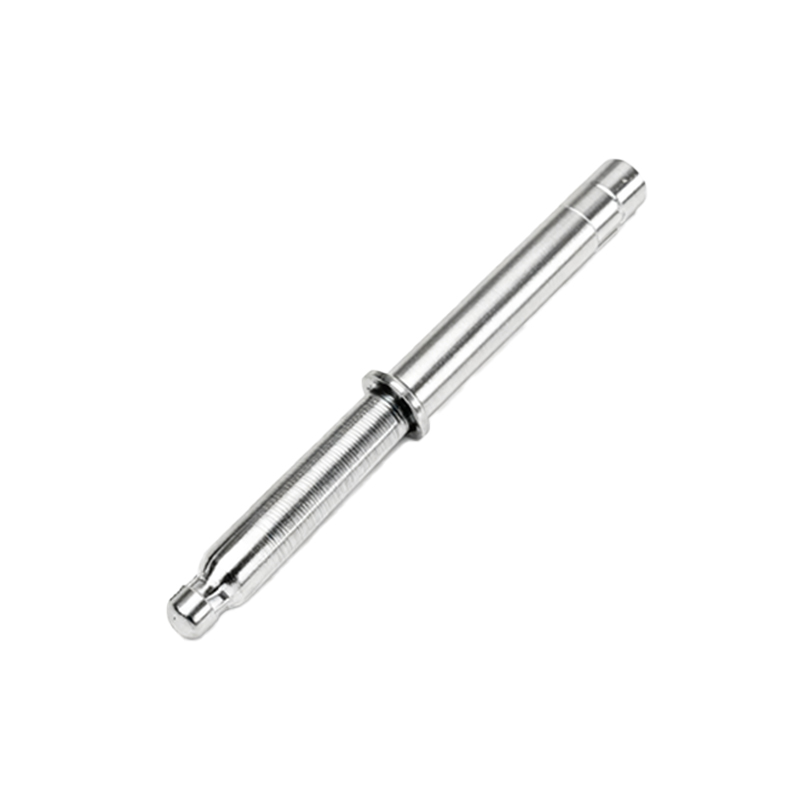
The structural diagram visually explains the working principle of proximity sensors for distance measurement. In inductive sensors, for example, the diagram shows how the oscillator creates an alternating magnetic field via the coil. When a metallic object enters this field, eddy currents are induced, altering the oscillation amplitude. This change is detected by the sensing element and processed by the signal conditioning circuit to calculate distance. For capacitive sensors, the diagram depicts electrodes forming an electric field; the presence of any object changes the capacitance, which is then measured. Ultrasonic sensors use a transducer to emit sound waves, with the diagram illustrating how the time delay of reflected waves is used to determine distance. The output stage converts these calculations into precise distance readings, enabling real-time monitoring and control in automated systems.
Types of Proximity Sensors and Their Structural Variations
Different types of proximity sensors for distance measurement have distinct structural diagrams tailored to their sensing technologies. Inductive sensors, shown in diagrams with coiled wire and ferrite cores, are ideal for detecting metals at short ranges, typically up to 60mm. Capacitive sensors, illustrated with parallel plates or electrodes, can sense both metallic and non-metallic materials, with diagrams emphasizing dielectric properties for ranges up to 40mm. Ultrasonic sensors, depicted with transducers and sound wave paths, offer longer detection distances, often exceeding 10 meters, suitable for level measurement or obstacle avoidance. Optical sensors, though less common in proximity applications, may include LEDs and photodetectors in their diagrams. Each type’s structure is optimized for specific environments, such as high-temperature areas or corrosive settings, with diagrams highlighting material choices and sealing methods.
Applications and Benefits of Understanding the Diagram
Analyzing the structural diagram of proximity sensors for distance measurement enhances their application across industries. In automotive manufacturing, diagrams help engineers integrate sensors into robotic arms for precise part positioning, reducing errors and improving efficiency. In logistics, understanding the housing and output stages from diagrams ensures reliable operation in warehouse automation for inventory tracking. Benefits include enhanced troubleshooting, as diagrams allow quick identification of faulty components like damaged coils or circuit issues. Additionally, diagrams aid in customization, enabling modifications for harsh conditions, such as adding shielding for electromagnetic interference. By leveraging these insights, companies can achieve higher accuracy, lower maintenance costs, and increased safety in systems like conveyor belts or machine guards.
Design Considerations and Future Trends
The structural diagram also informs design considerations for proximity sensors in distance measurement. Engineers must account for factors like sensing range, response time, and environmental resilience, as depicted in component layouts. For instance, diagrams show how compact designs with integrated circuits reduce size for space-constrained applications. Future trends, illustrated in evolving diagrams, include the integration of IoT capabilities, with wireless modules and smart sensors enabling remote monitoring and data analytics. Miniaturization and energy-efficient components are becoming prominent, allowing for battery-powered sensors in mobile devices. Advances in materials, such as graphene-based sensing elements, may further enhance sensitivity and durability. By studying these diagrams, professionals can anticipate innovations and adapt to emerging