Introduction to Photoelectric Sensing
Photoelectric sensors are ubiquitous in industrial automation, offering non-contact detection of objects based on the modulation of a light beam. Their operation hinges on a fundamental principle: the conversion of light energy into an electrical signal. At the core of every photoelectric sensor system lies a measurement principle diagram, a schematic that visually decodes the interaction between the emitter, the target, the receiver, and the subsequent signal processing circuitry. Understanding this diagram is not merely an academic exercise; it is essential for selecting the right sensor, troubleshooting system faults, and designing robust automation solutions. This article delves into the components and signal flow depicted in a typical photoelectric sensor measurement schematic, providing a detailed analysis for engineering professionals.
Core Components of the Schematic
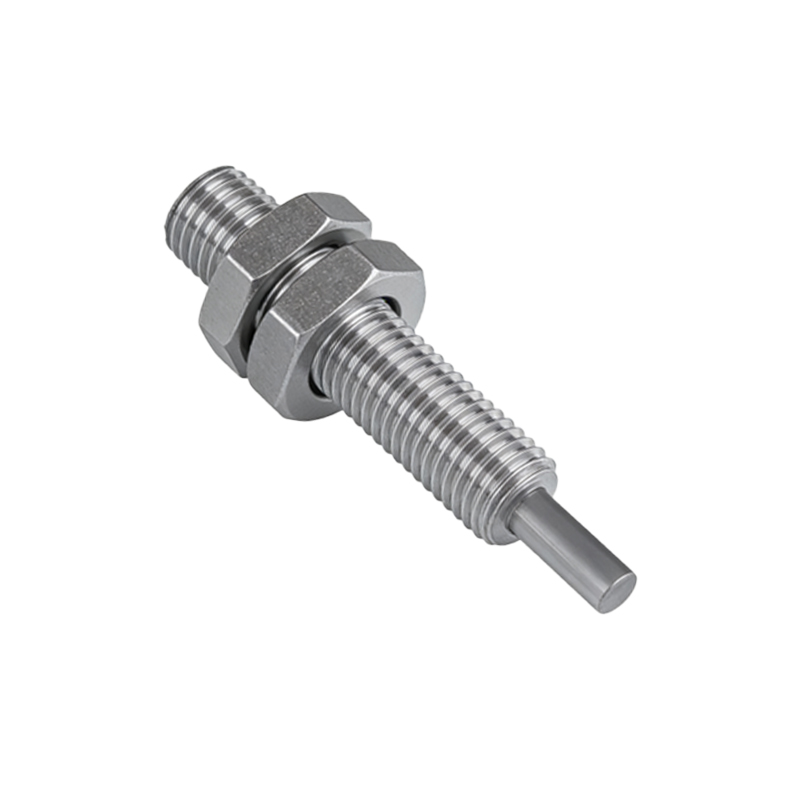
A standard measurement principle diagram for a photoelectric sensor comprises several key blocks. The first is the Light Emitter, typically a Light Emitting Diode (LED) for visible red, infrared, or laser light. The diagram shows this component driven by a constant current or pulsed driver circuit to ensure stable light output. Next is the Optical Path, illustrated with lines or beams representing the transmitted light. This section may include lenses for beam focusing or collimation. The Target Object is shown interrupting or reflecting this optical path. The third major block is the Photoelectric Receiver, usually a phototransistor, photodiode, or in some advanced cases, a Position Sensitive Device (PSD). This component is responsible for converting the received light intensity back into a proportional electrical current.
Signal Processing Chain
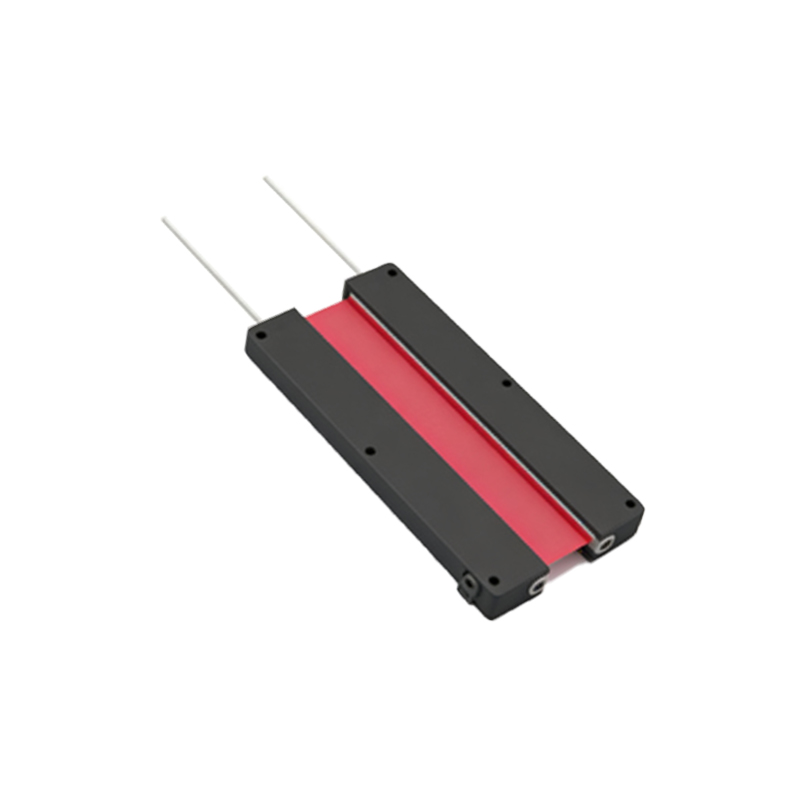
The raw signal from the receiver is weak and requires conditioning. The schematic details the Amplifier Stage, which boosts the minute photocurrent to a usable voltage level. Following amplification, a Filter Circuit is often employed to remove ambient light noise (like 50/60 Hz flicker from room lighting) and high-frequency electrical interference. The cleansed signal then proceeds to a Comparator. This is a critical decision-making point in the diagram. The comparator compares the processed signal voltage against a preset Threshold Level. This threshold, often adjustable via a potentiometer or digital interface shown in the diagram, determines the sensor's sensitivity. If the signal exceeds the threshold (in a retro-reflective or thru-beam mode when an object is present, or in a diffuse mode when an object reflects sufficient light), the comparator's output switches state.
Output Stage and Timing Logic
The output from the comparator triggers the Output Stage. This is represented by a solid-state switch (like a transistor) or a relay symbol. It controls the final output signal, which is commonly a discrete ON/OFF signal—either a PNP (sourcing) or NPN (sinking) DC output, or a relay contact. The diagram also incorporates Timing and Logic Circuits. These blocks manage functions such as response time delay, one-shot pulse output, and operating mode logic (e.g., light-on/ dark-on operation). A "light-on" mode means the output activates when the receiver detects light, while "dark-on" activates when the light beam is blocked. This logic is clearly defined in the schematic's annotation.
Differentiating Sensing Modes in Diagrams
The schematic varies slightly depending on the sensing mode. For a Thru-Beam (Through-Beam) Sensor, the diagram clearly separates the emitter and receiver into two distinct units, with the optical path traveling from one to the other. An object is detected when it blocks this beam. A Retroreflective Sensor diagram shows both emitter and receiver in the same housing. The optical path is directed towards a retroreflector, and the diagram includes a symbol for this reflector. Detection occurs when the beam is blocked from returning. For a Diffuse (Proximity) Sensor, the diagram illustrates the emitter and receiver co-located, with the optical path reflecting off the target itself. The schematic for this mode often highlights the importance of target reflectivity and distance on the signal strength at the receiver.
Key Parameters Illustrated
A well-drawn principle diagram provides implicit information about key sensor parameters. The Sensing Distance is implied by the optical path length and lens design. The Response Time is governed by the speed of the emitter driver, receiver, and signal processing chain shown. The diagram also hints at Environmental Immunity. For instance, a synchronous detection method (where the emitter is pulsed at a specific frequency and the receiver circuit is tuned to that same frequency) is often shown with a clock signal driving the emitter and a synchronized demodulator in the receiver block. This technique is crucial for rejecting ambient light, a fact made clear in the schematic's architecture.
Practical Application and Troubleshooting
Engineers use this measurement principle diagram as a roadmap for system integration and diagnostics. When a sensor fails to detect an object, referencing the schematic allows for a methodical check: Is the emitter powered and pulsing (check driver circuit)? Is the optical path obstructed or misaligned? Is the received signal too weak due to dirt, poor reflectivity, or incorrect distance (observe signal level before the comparator)? Is the threshold set incorrectly? Is the output stage damaged? By understanding the signal flow at each stage depicted in the diagram, engineers can quickly isolate the fault to a specific component or functional block, saving valuable downtime in production environments.
Conclusion and Technological Trends
The photoelectric sensor measurement principle diagram is a vital tool that translates optical physics into actionable electronic logic. Mastery of its components—from the emitter driver to the output comparator—empowers engineers to deploy these sensors effectively across countless applications, from packaging and material handling to automotive assembly and beyond. Modern trends are adding complexity to these schematics, incorporating blocks for digital communication (IO-Link), advanced background suppression logic using triangulation principles, and integrated diagnostics. However, the fundamental principle of light-to-signal conversion and threshold-based switching remains constant, firmly anchored in the classic diagram that continues to be the blueprint for reliable photoelectric sensing.