Introduction to Proximity Limit Sensors
Proximity limit sensors are fundamental components in modern industrial automation and machinery. These non-contact devices detect the presence or absence of an object within a specified sensing range without any physical contact. They play a critical role in positioning, counting, and safety applications across various sectors, including automotive manufacturing, packaging, and material handling. Unlike mechanical limit switches, proximity sensors offer higher reliability, longer service life, and faster response times because they have no moving parts that can wear out. Their operation is based on the principle of generating an electromagnetic field or a beam of radiation and detecting changes in that field caused by a target object. This article provides a detailed, diagram-supported explanation of their core working principles.
Core Operating Principle and Sensor Types
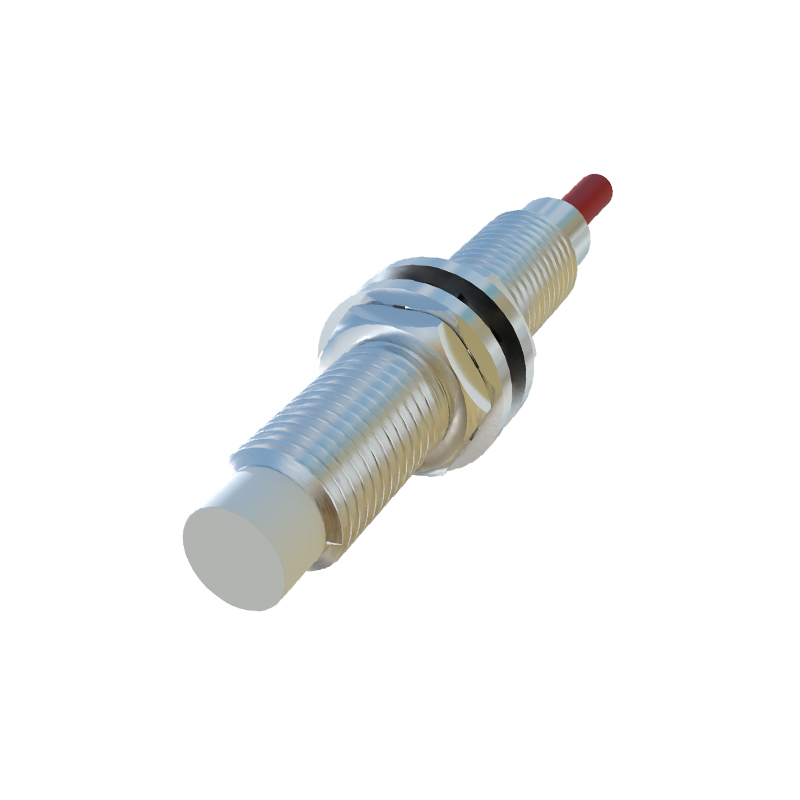
The fundamental principle behind all proximity sensors is the disturbance of a sensing field. The primary types are Inductive, Capacitive, Ultrasonic, and Photoelectric sensors, each suited for different target materials and environments. Inductive sensors are the most common for metal detection. They contain an oscillator circuit that generates a high-frequency electromagnetic field at the sensing face. When a metallic target enters this field, eddy currents are induced on the target's surface. These eddy currents draw energy from the oscillator, causing a reduction in the oscillation amplitude. This change is detected by a threshold circuit, which subsequently triggers a solid-state switch to change the output state (e.g., from OFF to ON). A simplified block diagram would show: Oscillator -> Sensing Coil -> Detection Circuit -> Output Switch.
Inductive Sensor Internal Block Diagram
A detailed internal diagram of an inductive proximity sensor clarifies the signal flow. The core components are: 1) The Oscillator, which generates the high-frequency alternating magnetic field. 2) The Ferrite Core with Coil, which focuses the electromagnetic field toward the sensing face. 3) The Demodulator/Amplifier, which converts the change in oscillation amplitude into a DC signal. 4) The Trigger/Schmitt Trigger Circuit, which compares the signal to a preset threshold to ensure a clean, bounce-free switching action. 5) The Output Stage, typically an NPN or PNP transistor that switches the load connected to the sensor's output wire. 6) The Power Supply Regulator, providing stable voltage to all internal circuits. The target's approach directly affects the oscillator stage, initiating this chain reaction.
Key Performance Characteristics
Understanding a sensor's datasheet requires knowledge of key parameters illustrated by operational diagrams. The "Sensing Distance" (Sn) is the nominal range at which a standard target will be reliably detected. Diagrams often show this as a distance from the sensor face. The "Hysteresis" is the difference between the switch-on point (as the target approaches) and the switch-off point (as it moves away). This prevents output chattering if the target vibrates at the sensing edge. "Repeatability" is the sensor's ability to consistently detect the target at the same point. "Response Frequency" indicates how many sensing operations per second the sensor can perform, crucial for high-speed counting. Diagrams plotting output state versus target distance effectively visualize hysteresis and sensing range.
Wiring and Output Configuration Diagrams
Proximity sensors have specific wiring configurations defined by their output type. The two main types are 2-wire and 3-wire DC sensors. A 3-wire sensor has separate wires for power supply positive (brown), power supply negative (blue), and the switched output signal (black). NPN (sinking) outputs switch the negative (0V) line to the load, while PNP (sourcing) outputs switch the positive voltage line. Connection diagrams are essential for proper integration into a control system, such as a Programmable Logic Controller (PLC). They show how to connect the sensor in series with the load (for 2-wire) or to the PLC's input module (for 3-wire), always including necessary protection devices like surge suppressors.
Application Examples and Installation Considerations
Diagrams are invaluable for planning sensor installation. Key considerations include the "Mounting" diagram, which specifies flush or non-flush mounting possibilities and the resulting reduction in effective sensing range for flush-mounted inductive sensors. "Sensing Field" diagrams illustrate the shape and extent of the detection zone, which is not just a point but a 3D field. Applications include position verification of a cylinder rod (diagram showing sensor mounted on cylinder body detecting the piston), rotary shaft revolution counting (sensor detecting a gear tooth or key on the shaft), and object detection on a conveyor. Diagrams for these scenarios highlight correct versus incorrect mounting positions relative to the target's path.