Understanding the Purpose of a Classification Diagram
A classification diagram for proximity sensors serves as a structured visual map, essential for engineers, designers, and procurement specialists. Its primary function is to organize the vast array of proximity sensor technologies into a logical, hierarchical framework. This diagram clarifies the relationships between different sensor types, their underlying operating principles, and their typical applications. Before drawing, one must define the diagram's scope: will it be a high-level overview for educational purposes or a detailed technical breakdown for R&D documentation? This initial decision dictates the depth of information and the number of branches in the final diagram. A well-constructed diagram not only aids in sensor selection but also facilitates communication across multidisciplinary teams, ensuring everyone references a common taxonomy.
Identifying Core Classification Criteria
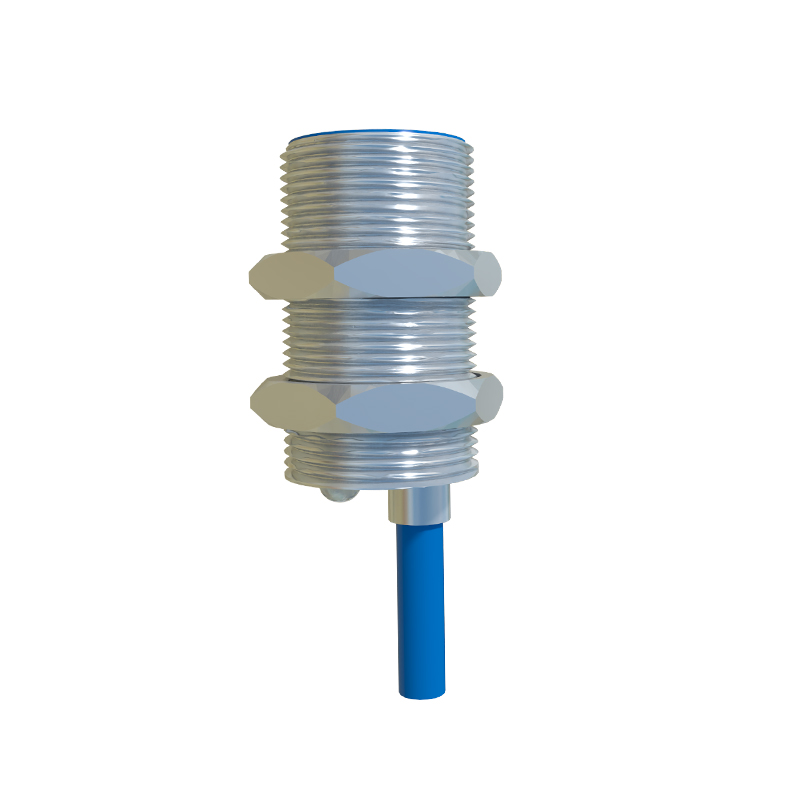
The foundation of an accurate diagram lies in selecting the correct classification criteria. The most fundamental and widely used criterion is the sensing principle or physical phenomenon the sensor exploits. This forms the primary branches of the diagram. Key categories include Inductive Sensors (for detecting metallic objects), Capacitive Sensors (for detecting both metallic and non-metallic materials), Ultrasonic Sensors (using sound waves), Photoelectric Sensors (using light beams), and Magnetic Sensors (like Hall effect or reed switches). Secondary classification levels can branch out from these based on factors such as output type (digital PNP/NPN, analog, IO-Link), sensing range, housing shape (cylindrical, rectangular), connection method (connector, cable), and specific features like weld-field immunity or high-temperature resistance.
Choosing the Right Diagramming Tool and Format
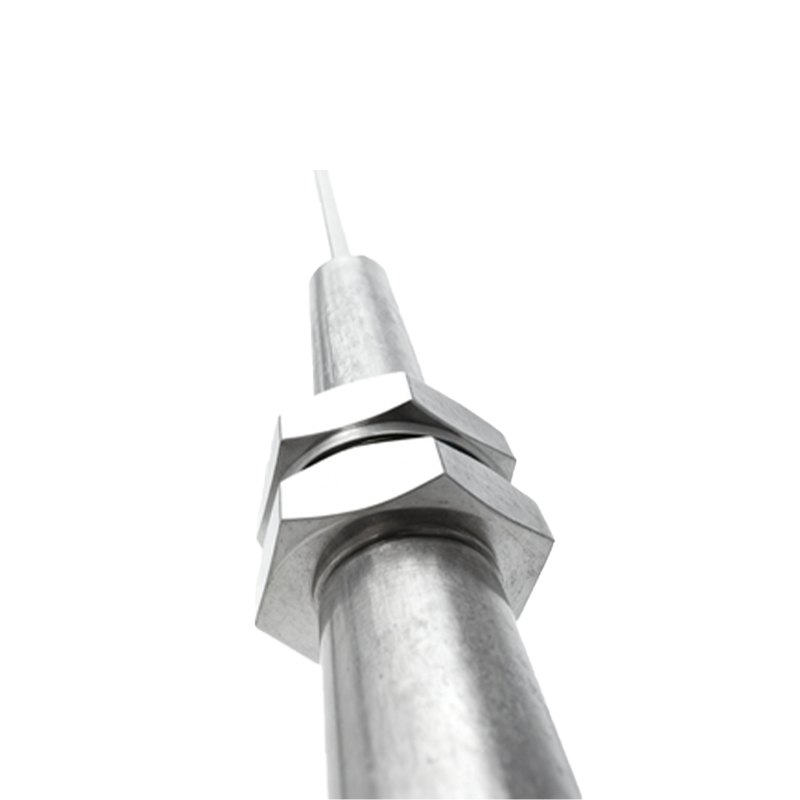
Select an appropriate tool based on the required formality and collaboration needs. For quick sketches or brainstorming, a whiteboard or simple drawing software suffices. For professional, shareable documents, dedicated diagramming software like Microsoft Visio, draw.io, Lucidchart, or even advanced tools like Enterprise Architect are ideal. These tools offer standardized shapes, connectors, and formatting options. The diagram format is typically a hierarchical tree structure flowing from top to bottom. The top node is the broad category "Proximity Sensors." The first tier below comprises the main sensing principles. Each principle then branches into sub-types, and further into specifications or variants. Consistency in shape, color, and line style is crucial for readability.
Structuring the Hierarchical Layout
Begin by placing the root element, "Proximity Sensors," at the top center of the canvas. Draw primary branches downward to the core sensing principles: Inductive, Capacitive, Ultrasonic, Photoelectric, and Magnetic. Under each principle, create the next level of classification. For instance, under "Photoelectric Sensors," common sub-types are Through-beam, Retro-reflective, Diffuse, and Background Suppression. Under "Inductive Sensors," you might classify by core type (shielded vs. unshielded) or output configuration. Use consistent geometric shapes for each level; rectangles are standard. Connect elements with clear, straight, or angled lines, avoiding crossover where possible. Leave ample white space to prevent clutter.
Adding Technical Details and Annotations
A basic tree diagram shows relationships, but a valuable engineering diagram incorporates key technical differentiators. Within or adjacent to each terminal branch (the end points), add concise annotations or icons. For example, next to "Capacitive Sensor," a small note could state "Detects liquids, plastics, wood." For "Ultrasonic Sensor," an annotation might indicate "Long-range, insensitive to color/dust." You can use color coding effectively: blue for all inductive sensors, green for photoelectric, etc. Consider adding a small symbol or representative waveform icon next to each primary branch to visually reinforce the operating principle without relying solely on text.
Reviewing and Validating the Diagram
Once the draft is complete, a critical review phase is mandatory. Cross-reference the diagram with technical datasheets from major sensor manufacturers like Siemens, Omron, Pepperl+Fuchs, and Balluff to ensure terminology and classifications align with industry standards. Verify that the hierarchy is logically sound and that no major sensor type is omitted. Check for clarity: is the diagram understandable to a junior engineer? Seek feedback from colleagues in different specializations, such as automation and mechanical design. Finally, ensure the diagram includes a title, a legend explaining any colors or symbols used, and a revision date. This transforms the drawing from a sketch into a formal reference document.