Introduction to Pulse Photoelectric Sensors
Pulse photoelectric sensors represent a critical advancement in industrial automation, offering precise detection capabilities through modulated light beams. Unlike continuous emission sensors, these devices emit light in controlled, high-frequency pulses. This operational principle significantly enhances their performance in challenging environments. The pulsed light technique allows for superior noise immunity, enabling reliable object detection even in the presence of ambient light interference from factory lighting or sunlight. Engineers rely on these sensors for applications demanding high accuracy and stability, such as precise counting, positioning on high-speed assembly lines, and detecting transparent or glossy objects that often confuse standard photoelectric sensors. The underlying technology involves a transmitter that emits infrared or visible light pulses and a receiver tuned to recognize only this specific pulsed signal, effectively filtering out constant light sources.
Analyzing Key Image Components
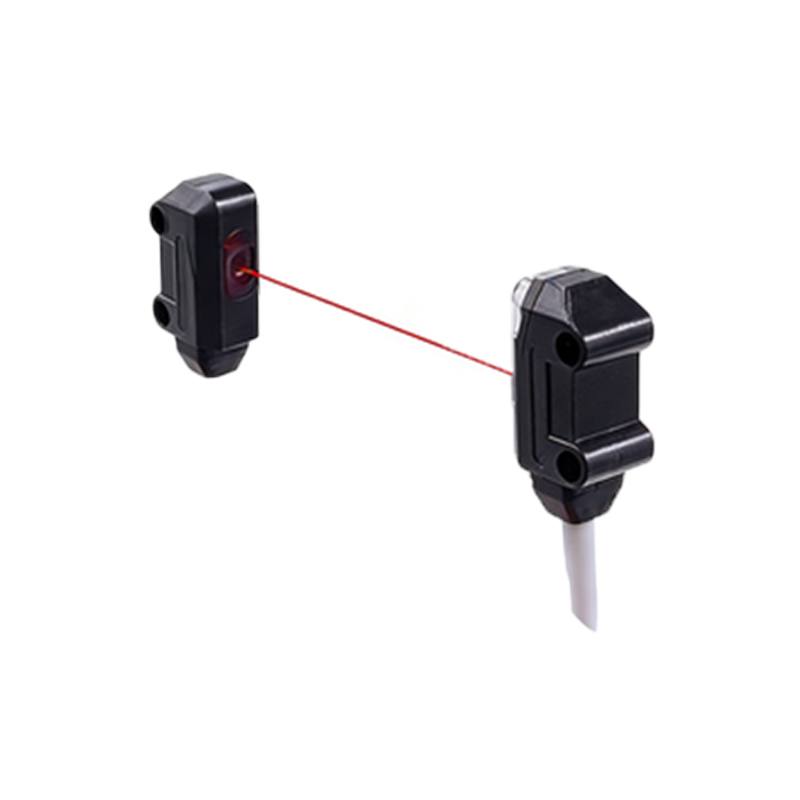
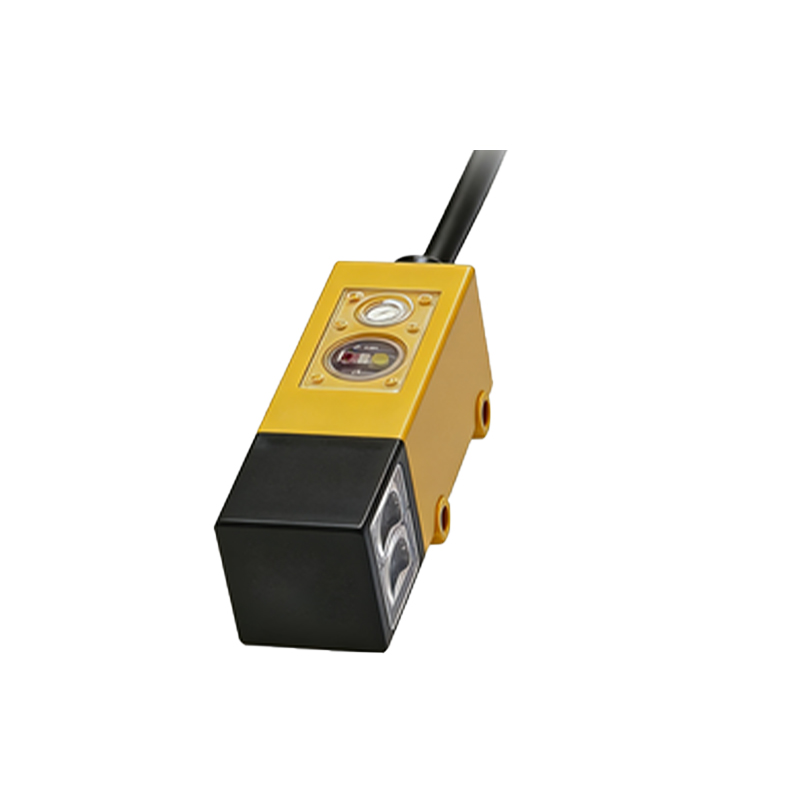
Technical images of pulse photoelectric sensors provide invaluable insights into their design and functionality. A standard product image typically showcases a compact, rugged housing, often constructed from metal or high-grade industrial plastic, indicating environmental resistance. Key visual elements include the clearly labeled emitter and receiver windows, which are often made of specialized lens materials to focus the pulsed beam. Internal component diagrams, frequently presented in cutaway views, reveal the pulse-generating circuitry, the light-emitting diode (LED) or laser diode, and the phototransistor or photodiode receiver. Wiring diagrams are another crucial image type, illustrating connection schemes for various output types (NPN/PNP) and power supply requirements. These images help engineers verify physical dimensions, mounting options (e.g., threaded barrel or bracket-style), and alignment indicators, which are vital for correct installation and beam alignment in tight machine spaces.
Interpreting Performance from Specifications Imagery
Charts and graphs accompanying sensor images are essential for interpreting performance parameters. A defining visual is the timing diagram, which plots the emitted pulse train against the received signal. This diagram clearly illustrates concepts like pulse width, frequency (often in the kHz range), and the sensor's response time. Another common image is the sensing distance chart, which shows the effective detection range under different conditions, often comparing performance for various target materials (e.g., white paper, transparent glass, black rubber). Beam dispersion diagrams are also critical, visually representing the size and shape of the light spot at different distances, which directly impacts detection precision. Engineers scrutinize these graphical data sheets to select a sensor with an appropriate pulse frequency for their application's speed and a sensing distance that matches their mechanical layout, ensuring no false triggers or missed detections.
Application-Specific Installation Imagery
Real-world application photos and setup schematics demonstrate how pulse photoelectric sensors solve specific industrial problems. A frequent image depicts the sensor mounted on a conveyor frame, with its pulsed beam crossing the path to count or detect the height of packages. Another common scenario shown is in packaging machinery, where a sensor verifies the presence of a label or a folded box flap. Images often highlight the use of opposed (through-beam) mode, where the emitter and receiver are in separate housings facing each other, or reflective mode, where a single unit detects light bounced off a dedicated reflector. Close-up installation photos emphasize proper alignment techniques, showing the use of alignment tools or the sensor's built-in LED indicators that signal beam reception. Troubleshooting guides use comparative images to show correct versus incorrect installation, such as the effects of sensor misalignment or contamination on the lens, which can attenuate the pulsed signal.
Advantages Visualized Through Comparative Diagrams
Comparative imagery powerfully illustrates the advantages of pulse technology over conventional continuous-light sensors. A key diagram contrasts signal waveforms, showing how a pulsed sensor's receiver can distinguish its own modulated signal from a background of steady ambient light, while a continuous sensor's output may be drowned out by noise. Side-by-side application photos might show both sensor types in a setting with strong ambient light, with the pulse sensor maintaining stable operation. Other diagrams explain the energy-saving benefit, as the pulsed operation reduces average power consumption and heat generation, leading to longer component life—a fact often highlighted by thermal imaging comparisons. Flowcharts using icons and simple graphics are also used to depict the decision-making process for selecting a pulse sensor, such as when detecting small objects, operating in dusty conditions, or requiring very fast response times where the synchronized pulse detection provides a clear edge.
Future Trends and Advanced Imaging
The evolution of pulse photoelectric sensors is reflected in advanced imaging and new product visuals. Modern datasheets include 3D models or CAD drawings that engineers can download for integration into machine design software. Images of new-generation sensors highlight features like IO-Link digital communication interfaces, indicated by specific connector icons or status LED patterns. Advanced timing charts now explain features like programmable pulse codes or multi-tasking abilities, where a single sensor can handle multiple detection functions through different pulse patterns. Concept imagery explores integration with vision systems, where a pulsed light source synchronizes with a high-speed camera to freeze motion for inspection. As Industry 4.0 progresses, network diagrams show these sensors as intelligent nodes, with images depicting their integration into a networked system topology, contributing data to a central control system for predictive maintenance and process optimization.