Introduction and Objective
This experimental report details the comprehensive testing and analysis of an analog photoelectric sensor system. The primary objective is to investigate the operational principles, characterize the performance parameters, and evaluate the practical application potential of a retro-reflective analog photoelectric sensor in a controlled laboratory environment. The experiment focuses on quantifying the relationship between the sensor's output signal and the distance to, or reflectivity of, a target object, thereby validating its suitability for continuous measurement and precision detection tasks in industrial automation.
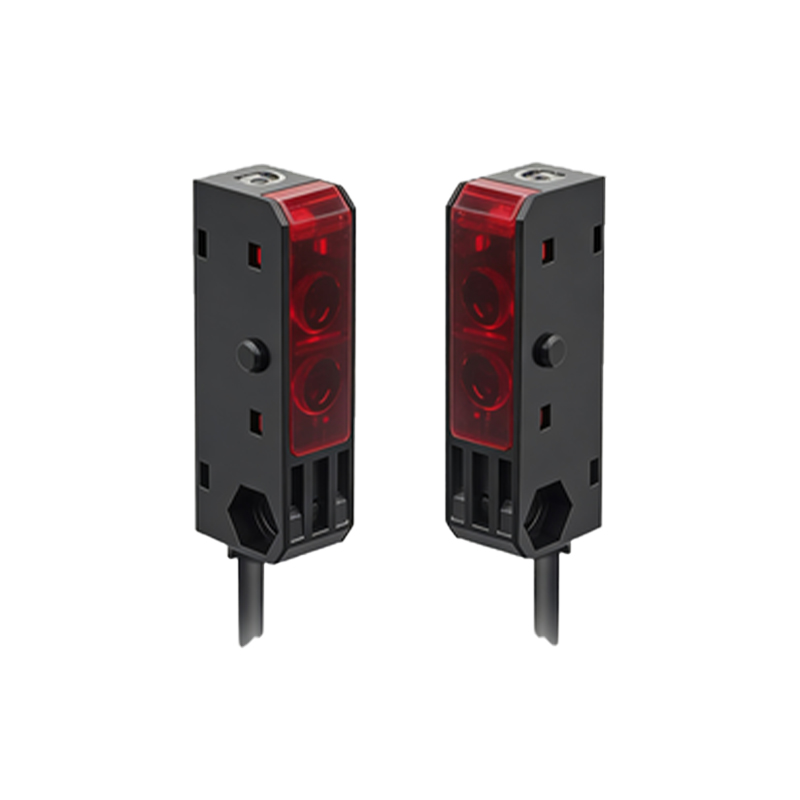
Theoretical Background and Sensor Principle
Analog photoelectric sensors operate on the fundamental principle of converting light intensity into a continuously variable electrical signal. The core components typically include an emitter (usually an LED or laser diode), a receiver (phototransistor or photodiode), and signal conditioning circuitry. In the retro-reflective mode used in this experiment, the emitter and receiver are housed in the same unit. The emitted light beam is directed towards a retro-reflector. When an object interrupts this beam, the amount of light returned to the receiver decreases. Unlike digital sensors that provide a simple ON/OFF output, the analog variant outputs a voltage or current signal proportional to the received light intensity. This allows for the detection of not just presence, but also position, transparency, or surface characteristics of an object.
Experimental Apparatus and Setup
The experimental setup comprised the following key components: a retro-reflective analog photoelectric sensor (12-24V DC, 0-10V analog output), a programmable DC power supply, a high-precision digital multimeter for voltage measurement, a set of calibrated gauge blocks for distance variation, targets with varying surface finishes (matte black, white, and reflective), a fixed retro-reflector, and a linear positioning stage with a micrometer for precise displacement control. The sensor was mounted on a stable optical bench, aligned precisely with the retro-reflector. The analog output wire was connected to the multimeter. The power supply was set to 12V DC to energize the sensor. The initial alignment ensured a stable maximum output voltage with no interrupting object.
Methodology and Testing Procedures
The testing was conducted in two phases. Phase One: Distance Characteristic Curve. A standard white target was mounted on the positioning stage between the sensor and the retro-reflector. Starting from a point very close to the sensor, the target was moved away in precise 1mm increments using the micrometer. At each position, the corresponding analog output voltage was recorded after allowing the reading to stabilize. This continued until the output voltage dropped to near zero, indicating the beam was fully interrupted. Phase Two: Reflectivity Response. The sensor-to-target distance was fixed at 50% of its rated sensing range. Different target materials (matte black, white paper, polished metal) were sequentially placed to interrupt the beam. The output voltage for each material was recorded, demonstrating the sensor's sensitivity to surface reflectivity.
Data Analysis and Results
The data from Phase One was plotted, generating a characteristic response curve of output voltage versus target distance. The curve exhibited a highly linear region in the middle of the sensing range, which is optimal for precise positional measurement. The sensitivity within this linear zone was calculated as the slope (ΔV/Δmm). Near the extremes of the range, the response became non-linear. The results from Phase Two clearly showed a direct correlation between target reflectivity and output voltage. The polished metal surface, acting as a quasi-mirror, yielded a significantly higher output voltage compared to the matte black surface at the same distance, as it reflected more light back to the receiver despite not being a perfect retro-reflector. This highlights the sensor's ability to discriminate between materials based on optical properties.
Discussion of Performance and Error Sources
The sensor demonstrated robust performance for analog measurement within its specified linear range. Key performance parameters derived include linearity error, repeatability, and hysteresis. Potential sources of error identified during the experiment include ambient light interference, though the sensor's modulated light source minimized this effect. Minor misalignments in the setup could lead to signal drift. Temperature variations might affect the output of both the LED emitter and the photodetector. Furthermore, the surface angle of the target and dust contamination on the lens or reflector can introduce measurement inaccuracies. These factors must be considered in real-world deployment.
Conclusion and Application Recommendations
In conclusion, this experiment successfully characterized the analog photoelectric sensor, confirming its principle of operation and quantifying its key performance metrics. The sensor provides a reliable, continuous analog signal suitable for applications requiring measurement rather than simple detection. Based on the findings, it is recommended for use in applications such as continuous edge guiding in web processing, transparency monitoring of films or bottles, thickness detection via differential measurement, and precise positioning where non-contact is essential. For optimal performance, installation should ensure proper alignment, protection from harsh ambient light, and regular maintenance of optical surfaces. Selecting a sensor with a range appropriate for the specific application is critical to operate within the linear response region.