Introduction to Proximity Sensor Wiring
Proximity sensors are fundamental components in modern industrial automation, enabling non-contact detection of objects. Understanding their wiring is crucial for correct installation, troubleshooting, and system integration. High-resolution wiring diagrams serve as indispensable tools for engineers and technicians, providing clear, detailed visual references that surpass the limitations of standard schematics. These diagrams illustrate not only the basic connections for power, ground, and output signals but also critical details such as shield grounding, load connections, and interface modules with programmable logic controllers (PLCs). The clarity offered by high-definition images ensures that every terminal, wire color code, and component symbol is easily identifiable, reducing the risk of wiring errors that can lead to sensor malfunction or system downtime.
Key Components in a High-Resolution Diagram
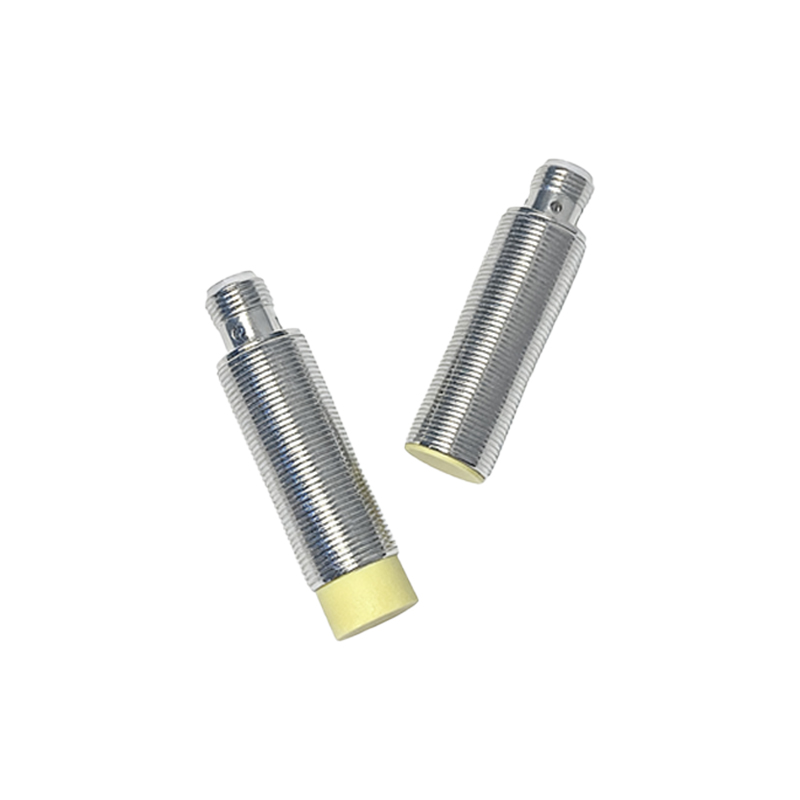
A high-quality proximity sensor wiring diagram will distinctly display several key elements. First, the sensor itself is shown with its housing and sensing face. The connection points, typically a quick-disconnect plug or a cable gland with lead wires, are clearly labeled. The diagram details the wire color conventions: brown for positive DC supply (+V), blue for common negative or DC 0V, and black for the switched output signal. For AC sensors, the standard is brown for Line (L) and blue for Neutral (N). Load devices, such as a PLC input module, a relay coil, or an indicator lamp, are shown connected to the sensor's output. Furthermore, protective components like surge suppressors or load resistors, often necessary for specific applications, are included in the diagram with precise connection points.
Wiring Configurations: Sinking vs. Sourcing
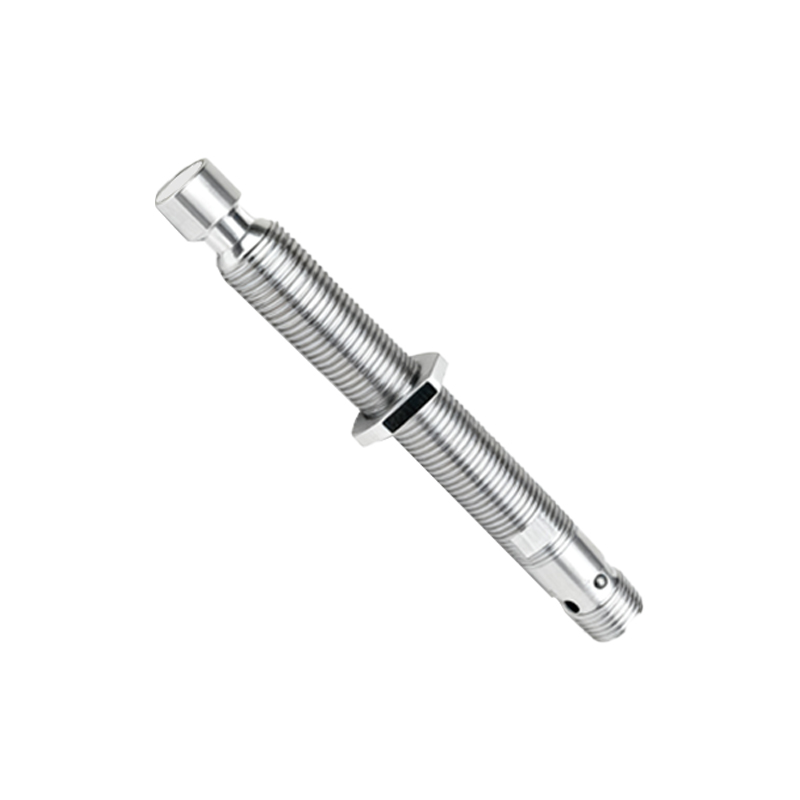
One of the most critical aspects clarified by a detailed diagram is the sensor's output configuration—sinking (NPN) or sourcing (PNP). A high-resolution image will make this distinction unmistakable. In a sinking (NPN) configuration diagram, the black output wire is shown connected to the load, which is then connected to the positive supply. The diagram visually communicates that the sensor's internal transistor switches the negative side of the load to ground. Conversely, in a sourcing (PNP) diagram, the output wire provides the positive voltage to the load, with the other side of the load connected to ground. Clear arrows or current flow indicators in the diagram help engineers quickly identify the configuration, which is essential for compatibility with the control system's input card.
Interfacing with PLCs and Control Systems
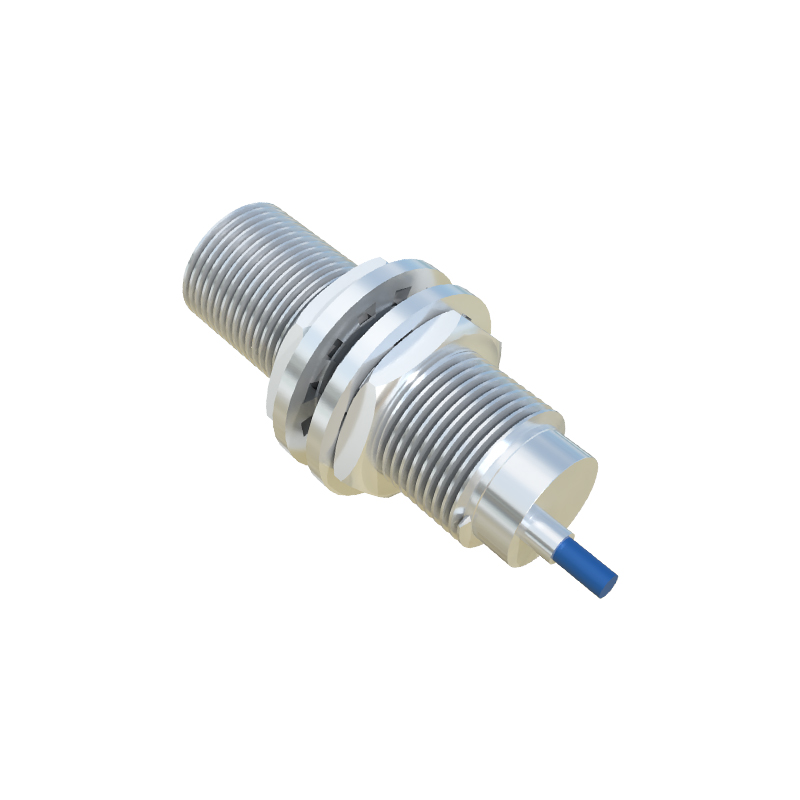
High-resolution wiring diagrams are particularly valuable when integrating proximity sensors into complex control systems like PLCs. These diagrams go beyond the sensor itself, illustrating the complete circuit path. They show the connection from the sensor output to the specific terminal on the PLC's digital input module. Details such as the need for a common connection between the sensor power supply and the PLC input common terminal are highlighted. Diagrams for 3-wire sensors connecting to a PLC will clearly show the separate power supply connections and the signal wire. For 2-wire AC sensors, the diagram demonstrates series connection with the PLC input. This level of detail prevents common mistakes, such as incorrect common referencing, which can render an entire bank of inputs inoperative.
Shielding and Noise Immunity Considerations
In electrically noisy industrial environments, proper shielding is paramount for reliable sensor operation. A comprehensive high-resolution wiring diagram dedicates a section to best practices for shielded cables. It illustrates how the cable's braided shield should be terminated: typically, connected to a functional earth (FE) or ground terminal at the control panel end, while left unconnected and insulated at the sensor end to avoid ground loops. The diagram may also show the use of ferrite cores on the cable near the sensor or controller to suppress high-frequency electromagnetic interference (EMI). These visual guidelines ensure that engineers implement noise reduction techniques correctly, safeguarding the sensor's signal integrity from disruptive noise generated by variable frequency drives (VFDs), motors, or welding equipment.
Practical Applications and Troubleshooting Aid
Beyond initial installation,高清线路图 serve as an essential reference for maintenance and troubleshooting. When a sensor fails to detect an object, technicians can refer to the diagram to systematically verify every connection point. They can check for correct power voltage at the specified terminals, measure the output signal state under different conditions, and verify the load connection. The diagram acts as a map, allowing for efficient isolation of the fault—whether it lies in the sensor, the wiring, the power supply, or the load (e.g., the PLC input). Furthermore, for retrofit projects or modifications, these diagrams provide a clear record of the as-built wiring, ensuring any changes are made consistently and safely, maintaining system integrity.