Introduction to Linear Photoelectric Sensors
Linear photoelectric sensors are critical components in industrial automation, widely used for precise detection, positioning, and measurement tasks. These sensors operate based on the photoelectric effect, converting light signals into electrical outputs. Unlike point-type sensors, linear variants provide continuous or multi-point sensing along a defined axis, making them ideal for applications requiring dimensional analysis or edge detection. The core principle involves emitting a light beam—typically from an LED or laser diode—toward a target, with a receiver capturing the reflected or transmitted light. Variations in light intensity due to target presence, distance, or surface properties generate proportional electrical signals. This functionality enables high-accuracy monitoring in manufacturing, packaging, and robotics, where reliability and repeatability are paramount. Understanding the underlying diagram helps in selecting and integrating these sensors effectively.
Key Components in the Principle Diagram
A standard linear photoelectric sensor diagram includes several essential elements: a light source, optical system, photodetector, signal processing circuit, and output interface. The light source, often a modulated LED or laser, emits a focused beam through lenses or apertures in the optical system to ensure collimation and reduce dispersion. The photodetector, such as a photodiode or phototransistor array, receives the light after interaction with the target. In reflective-type sensors, the detector captures light bounced off the target, while in through-beam types, it senses transmitted light. The signal processing circuit amplifies and filters the detector's output, converting analog light variations into digital or analog electrical signals. Finally, the output interface transmits data to controllers like PLCs. This structured arrangement, depicted in diagrams, highlights how each part contributes to linear sensing capabilities.

Working Principle and Light Path Illustration
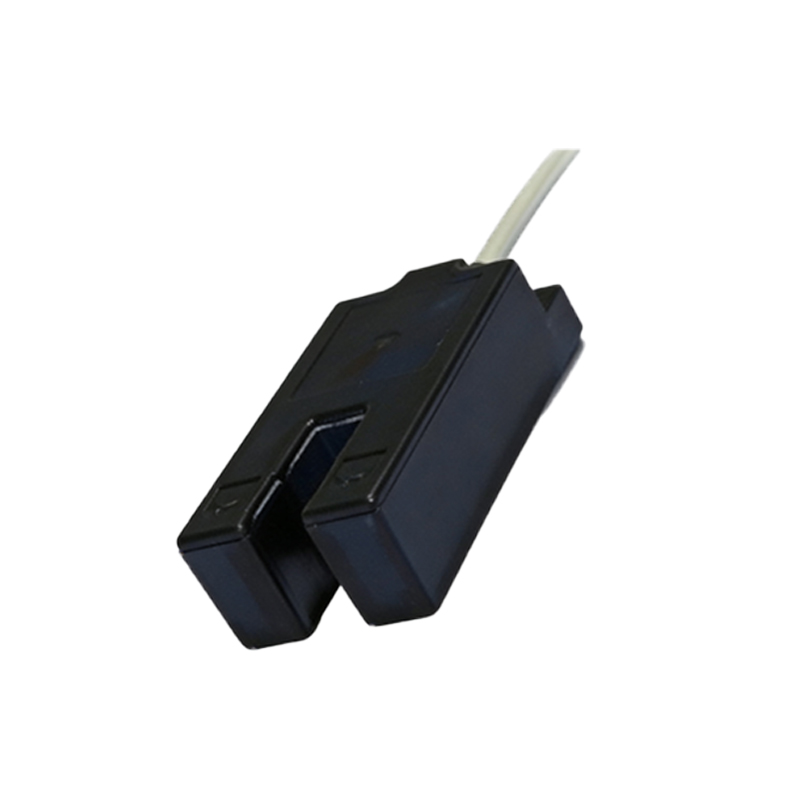
The working principle revolves around the interruption or modulation of light by a target object. In a typical diagram, the light path is shown as straight lines from emitter to receiver, with arrows indicating direction. For diffuse reflection sensors, the emitter and receiver are housed together; light strikes the target and scatters back to the receiver. Specular reflection types use angled paths for shiny surfaces. Through-beam sensors separate emitter and receiver, with the target blocking the beam entirely. Linear sensors often employ a linear CCD or CMOS array as the receiver, allowing detection of multiple points along a line. Diagrams illustrate how target movement alters the light pattern on the detector array, generating voltage changes. For instance, a moving object may progressively obscure parts of the array, producing a linear output proportional to position. This visual representation clarifies alignment and calibration needs for accurate operation.
Types of Linear Photoelectric Sensor Configurations
Diagrams differentiate between common configurations: through-beam, retro-reflective, and diffuse reflection. Through-beam linear sensors feature separate emitter and receiver units aligned opposite each other, offering high accuracy and long sensing ranges. Diagrams show the light beam traveling directly, with any obstruction triggering an output. Retro-reflective types use a reflector to bounce light back to a combined emitter-receiver unit; targets break this reflected path. Diffuse reflection sensors have integrated units where light reflects directly off the target's surface, suitable for varied colors and textures. Additionally, background suppression variants are diagrammed with triangulation paths to ignore distant objects. Each configuration's diagram highlights unique light paths and component placements, aiding in selection based on application requirements like range, environmental conditions, and target properties.
Signal Processing and Output Interpretation
The principle diagram extends to signal processing stages, crucial for converting raw light data into usable outputs. After the photodetector generates a current proportional to light intensity, amplification circuits boost weak signals. Filtering removes noise from ambient light or electrical interference. In linear sensors, analog-to-digital converters (ADCs) often digitize the signal for precise linear position calculation. Diagrams depict these circuits as blocks between detector and output, showing waveforms that represent signal changes. For example, a graph might display voltage versus time or position, indicating how target movement affects output. Output types include analog (e.g., 0-10V, 4-20mA) for continuous measurement or digital (e.g., NPN/PNP) for switch-like behavior. Interpreting these diagrams helps technicians troubleshoot issues like signal drift or insufficient response, ensuring optimal sensor performance.
Applications and Practical Considerations
Linear photoelectric sensors are deployed in diverse industries, illustrated through application diagrams. In manufacturing, they monitor conveyor belt object positions, detect edges in cutting machines, or measure widths in roll-to-roll processes. Robotics diagrams show sensors guiding arm movements by tracking linear paths. Packaging lines use them for label alignment or fill-level detection. Diagrams often include real-world setups, emphasizing installation angles, mounting brackets, and environmental shields. Practical considerations from diagrams involve alignment precision—misalignment can cause false triggers—and maintenance of optical surfaces to prevent dust accumulation. Understanding these diagrams aids in configuring sensors for specific tasks, such as adjusting sensitivity or selecting housing materials for harsh conditions, thereby enhancing system reliability and efficiency.
Advantages and Limitations from Diagram Analysis
Analyzing principle diagrams reveals key advantages: non-contact operation reduces wear, linear output allows continuous monitoring, and fast response suits high-speed applications. Diagrams show compact designs enabling integration into tight spaces. However, limitations are also evident. Ambient light interference may appear as stray lines in diagrams, requiring shielding or modulation techniques. Diagrams of diffuse sensors highlight reduced accuracy on dark or absorbent surfaces due to weak reflections. Through-beam diagrams indicate installation complexity from separate units. By studying these aspects, engineers can mitigate drawbacks—for example, using polarized light in diagrams to counter specular reflections—or choose alternative sensors like ultrasonic types for challenging environments. This diagram-based analysis supports informed decision-making in sensor deployment.
Conclusion and Future Trends
Linear photoelectric sensor principle diagrams serve as vital tools for understanding and applying these devices in automation. They encapsulate the interplay of optics, electronics, and mechanics, facilitating education and innovation. Future trends, hinted in advanced diagrams, include integration with IoT for smart sensor networks, miniaturization of components, and enhanced signal processing via AI algorithms. Diagrams may evolve to show multi-axis sensing or hybrid systems combining photoelectric and vision technologies. As industries advance toward Industry 4.0, mastering these diagrams will remain essential for optimizing automated systems, ensuring precision, and driving efficiency in global manufacturing and beyond.