Introduction to Photoelectric Sensors
Photoelectric sensors are versatile devices widely used in industrial automation for detecting the presence, absence, or distance of objects. They operate by emitting a light beam, typically from an LED or laser diode, and then measuring the reflected or interrupted light. These sensors are essential in applications such as packaging, material handling, assembly line monitoring, and safety systems. Their non-contact nature ensures minimal wear and tear, providing long-term reliability. Understanding the fundamental principles behind photoelectric sensors is crucial for selecting the right type for specific operational needs. This guide offers a detailed diagram-based overview to demystify their components and functionality.
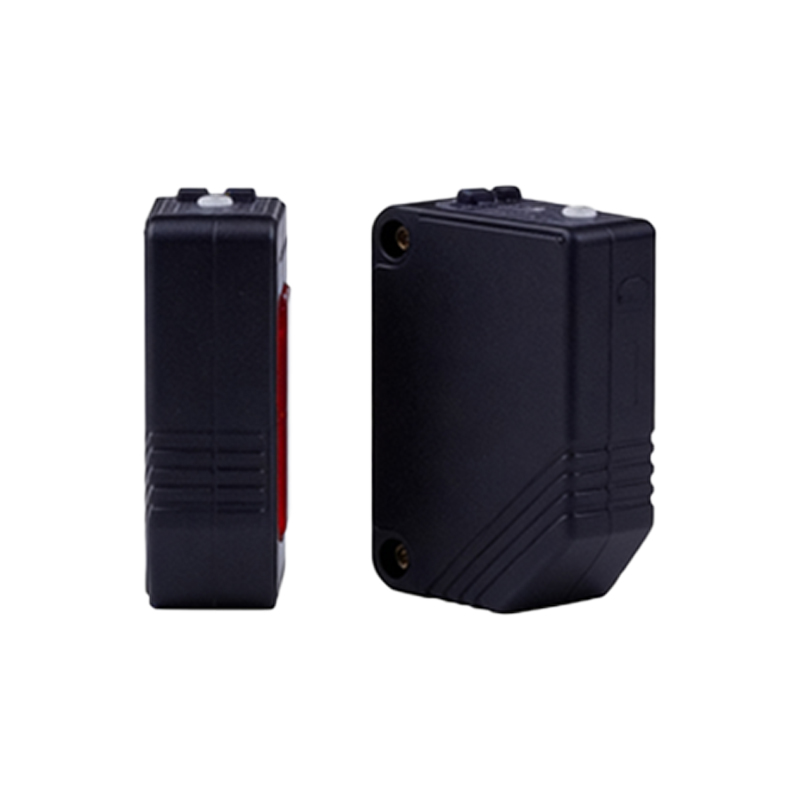
Core Components and Internal Structure
A typical photoelectric sensor consists of several key components. The light emitter generates the beam, often using infrared, visible red, or laser light sources for different sensing ranges and environments. Opposite the emitter is the receiver, which detects changes in the light pattern. The sensor housing protects these elements from dust, moisture, and mechanical impacts, with ratings like IP67 common in industrial models. Internal circuitry includes amplifiers and signal processors that convert light intensity variations into electrical outputs. Diagrams typically illustrate these parts in cross-section, showing how emitted light travels to the target and back, highlighting the precision alignment required for optimal performance.
Operating Principles and Sensing Modes
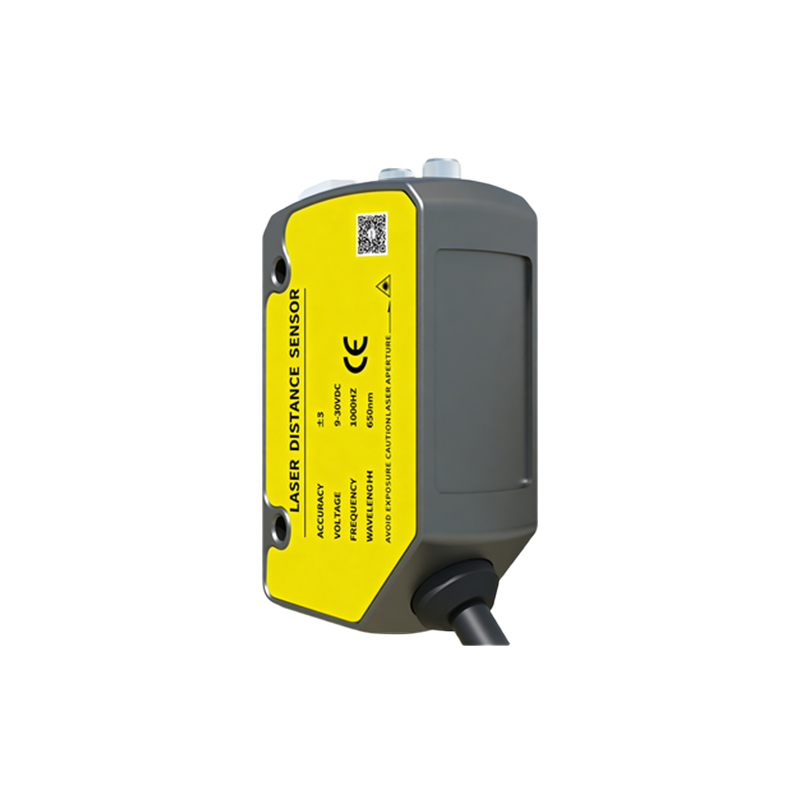
Photoelectric sensors function based on three primary modes: through-beam, retro-reflective, and diffuse reflection. In through-beam mode, separate emitter and receiver units are placed opposite each other; an object is detected when it interrupts the light beam. Retro-reflective mode uses a single unit with both emitter and receiver, along with a reflector; detection occurs when the reflected beam is blocked. Diffuse reflection mode relies on light bouncing directly off the target back to the receiver, suitable for detecting non-reflective surfaces. Diagrams for each mode visually depict light paths and interruption points, aiding in understanding how environmental factors like color, texture, and distance affect sensitivity.
Wiring and Electrical Connections
Proper wiring is vital for sensor integration into control systems. Most photoelectric sensors feature multiple wires for power supply, output signals, and configuration. Common configurations include NPN (sinking) and PNP (sourcing) outputs, compatible with PLCs and other industrial electronics. Wiring diagrams show connections for DC voltage inputs (e.g., 10-30 VDC), with detailed pinouts for relay or solid-state outputs. Additional wires may enable functions like teach-in programming for setting detection thresholds. These diagrams often include symbols for grounding, shielding, and load devices, ensuring safe installation and minimizing electrical noise interference in harsh plant environments.
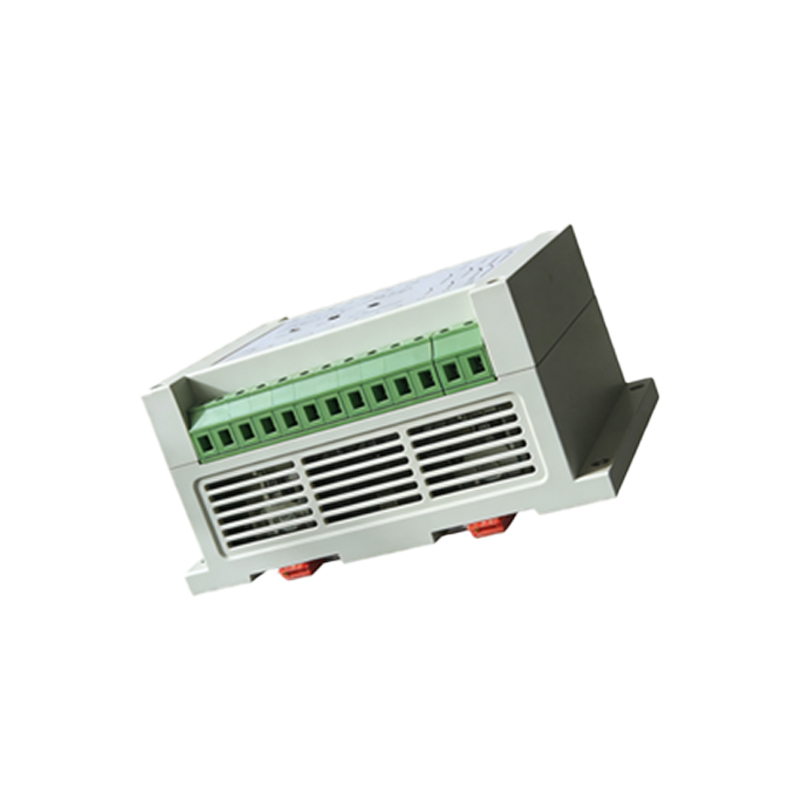
Application-Specific Configurations
Different industries require tailored sensor setups. For example, in conveyor systems, sensors with background suppression capabilities ignore distant objects, focusing only on items at a preset range. In transparent object detection, polarized filters help distinguish glass or plastic from reflections. Diagrams illustrate specialized setups, such as slot sensors for detecting small parts or fiber optic sensors for tight spaces. Each configuration is depicted with real-world scenarios, showing beam alignment, mounting angles, and target materials. This visual approach helps engineers anticipate challenges like ambient light interference or vibration, leading to more robust system designs.
Diagnostics and Troubleshooting Tips
Even reliable sensors can encounter issues. Common problems include misalignment, lens contamination, or electrical faults. Diagnostic diagrams highlight LED indicators for power, output status, and signal strength, enabling quick checks. For instance, a steady output LED might indicate continuous detection, while a flickering one could suggest intermittent beam blockage. Troubleshooting flowcharts guide users through steps like cleaning lenses, adjusting sensitivity potentiometers, or verifying voltage levels. These resources emphasize preventive maintenance, such as regular inspections for wear or environmental changes, to reduce downtime and extend sensor lifespan in demanding operations.
Future Trends and Innovations
Advancements in photoelectric sensor technology continue to enhance performance. Innovations include IO-Link connectivity for digital communication, allowing real-time data monitoring and remote configuration. Miniaturization leads to smaller sensors with higher precision, suitable for robotics and electronics manufacturing. Diagrams now incorporate smart features like temperature compensation or self-diagnostic algorithms, depicted as integrated circuit blocks. Emerging trends also focus on energy efficiency and compatibility with IIoT (Industrial Internet of Things) platforms. Visual guides help engineers adapt to these trends, showcasing how updated sensor designs offer greater flexibility and intelligence in automated systems.