Introduction to Proximity Sensor Design Imagery
Conceptual design images for proximity sensors serve as a critical bridge between theoretical specifications and practical implementation. These visual representations are not mere illustrations; they are engineered diagrams that communicate the operational principles, structural layout, and integration possibilities of various sensor types. For engineers and designers, these images provide a foundational understanding of how inductive, capacitive, ultrasonic, and photoelectric sensors are configured to detect the presence or absence of an object without physical contact. The precision in these visuals, from cross-sectional views showing coil windings in inductive sensors to ray-diagrams in optical types, is paramount for accurate application planning and troubleshooting in complex industrial environments.
Key Elements in Inductive Sensor Schematics
Design images for inductive proximity sensors meticulously detail the oscillator coil, detection circuit, and output switching components. A high-quality conceptual diagram will clearly illustrate the electromagnetic field generated by the oscillator, often depicted as concentric circles emanating from the sensor's face. The image typically highlights the ferrite core, the damping effect caused by an approaching metallic target, and the subsequent signal processing that triggers the output. These visuals are indispensable for selecting the correct sensor for specific metals and understanding the influence of factors like switching frequency and temperature ranges on performance.
Visualizing Capacitive Sensor Functionality
Conceptual pictures for capacitive sensors focus on illustrating the formation of an electrostatic field between the sensor's active surface and the target object. Effective design imagery will show the sensor's internal electrode arrangement and how the dielectric constant of the target material affects capacitance change. Diagrams often include representations of non-metallic materials like liquids, plastics, or wood within the detection field, emphasizing the sensor's versatility. These images help engineers visualize adjustment mechanisms for sensitivity to counteract environmental influences such as humidity or dust accumulation on the sensor surface.
Optical and Ultrasonic Sensor Layout Diagrams
For photoelectric and ultrasonic proximity sensors, design images take on a more geometric nature. Photoelectric sensor concepts use precise ray tracings to differentiate between through-beam, retro-reflective, and diffuse-reflective modes. The placement of the emitter, receiver, and any reflectors is critically shown. Ultrasonic sensor images, conversely, depict the transducer emitting sound wave cones and receiving echoes. These visuals are crucial for calculating beam angles, understanding blind zones, and planning installations to avoid acoustic interference or misalignment, which are common pitfalls in automated material handling and level detection systems.
Integration and Mounting Considerations in Design
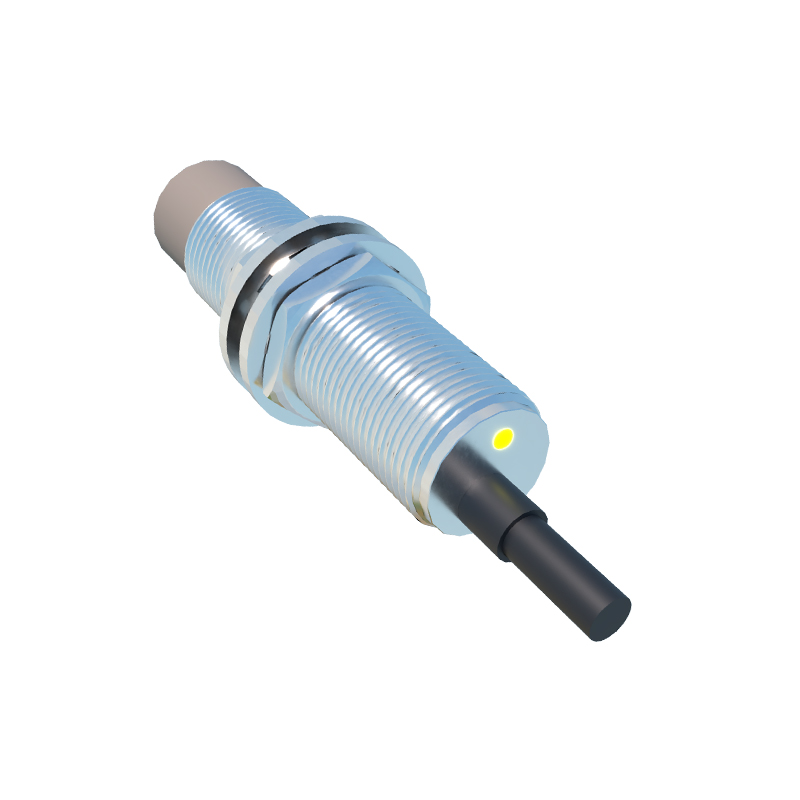
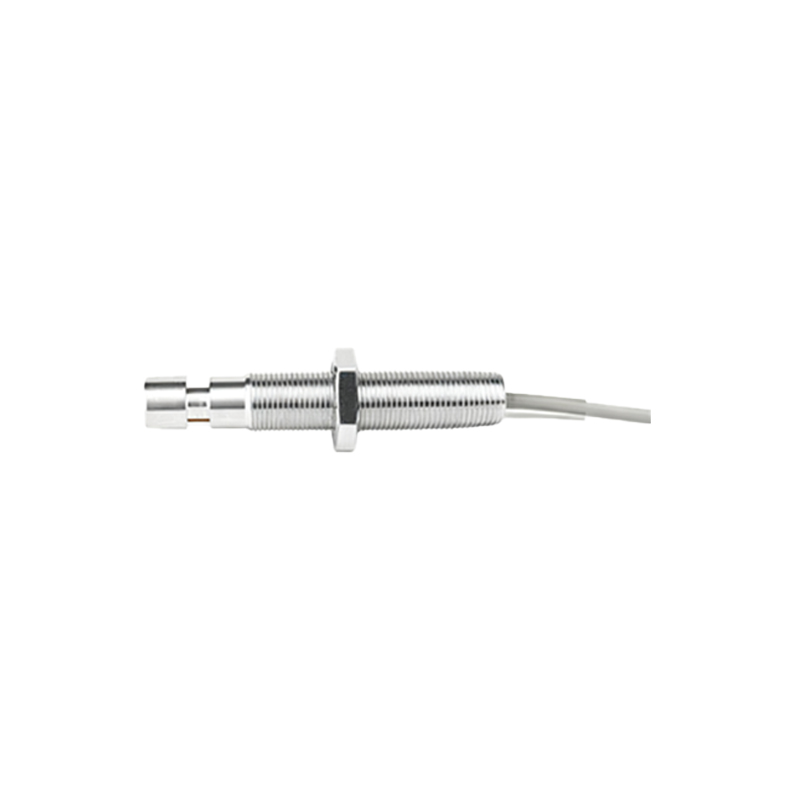
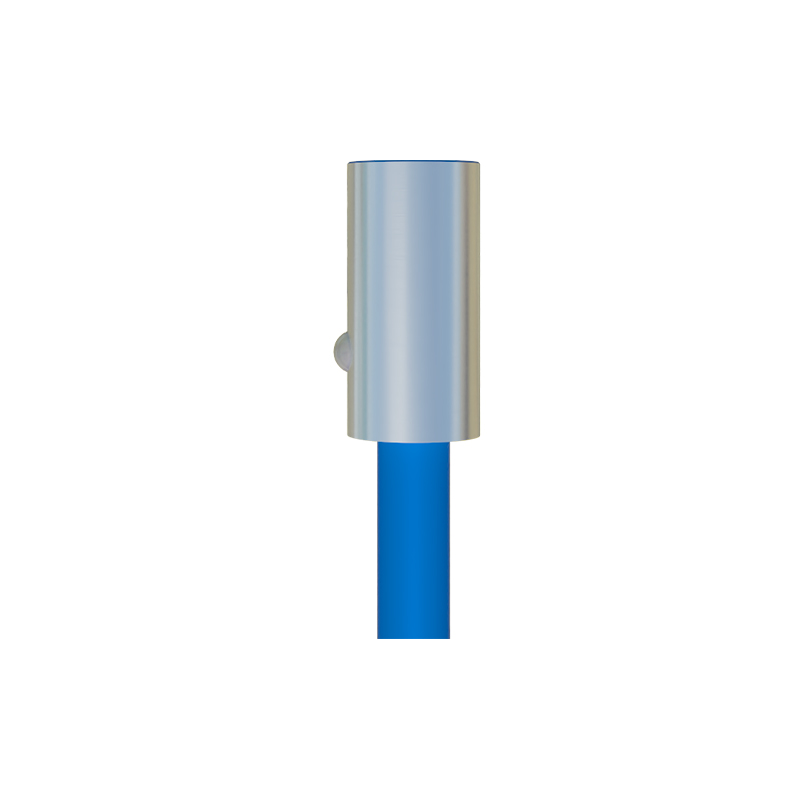
Beyond core functionality, superior conceptual imagery addresses mechanical integration. This includes detailed dimensional drawings, threaded housing designs (e.g., M8, M12, M18, M30), and depictions of flush or non-flush mounting scenarios. Images often show the sensor embedded in a machine panel, with clearances indicated to prevent mutual interference between multiple sensors. Wiring diagrams, showcasing connection types like PNP/NPN, NO/NC, and cable/connector variants, are an integral part of these design packages, ensuring seamless integration into PLC-controlled systems.
The Role of Simulation and Cutaway Views
Advanced conceptual designs now incorporate simulated detection zones, often rendered in translucent 3D models. These images visually define the sensor's nominal sensing range and the shape of its effective field—a key factor for precise positioning applications. Exploded-view or cutaway diagrams reveal internal component assembly, sealing methods for achieving high IP ratings (e.g., IP67, IP69K), and the arrangement of status LEDs. Such detailed visuals are vital for applications in harsh conditions, such as food processing or automotive manufacturing, where robustness and reliability are non-negotiable.
From Concept to Application: Selecting the Right Sensor
Ultimately, the power of these conceptual design images lies in their application. A comprehensive set of images will guide an engineer through the selection process by visually comparing sensing distances, response times, and output characteristics across a product family. They translate datasheet parameters into tangible operational expectations. By studying these engineered visuals, professionals can preemptively solve design challenges, optimize machine layouts, and ensure that the chosen proximity sensor delivers precise, reliable, and maintenance-free operation in the field, forming the invisible yet essential nervous system of modern automation.