Introduction to Photoelectric Proximity Sensors
Photoelectric proximity sensors are essential components in modern automation and industrial systems, designed to detect the presence or absence of objects without physical contact. These sensors operate based on the principle of light emission and reception, utilizing various light sources such as LEDs or laser diodes. The core function involves emitting a light beam and analyzing the reflected or interrupted signal to determine object proximity. Widely used in manufacturing, robotics, and safety applications, they offer high precision, fast response times, and reliability in diverse environments. Understanding their structure is key to optimizing performance in real-world scenarios, from conveyor belt monitoring to object counting tasks.
Key Components of the Structure Diagram
A typical photoelectric proximity sensor comprises several integral parts, each contributing to its detection capabilities. The emitter section includes a light source, often an infrared LED, and a lens to focus the beam. The receiver section consists of a phototransistor or photodiode paired with a lens to capture reflected light. Additional elements are the housing, which protects internal circuitry from dust, moisture, and mechanical damage, and the signal processing unit that converts light signals into electrical outputs. Wiring terminals or connectors facilitate integration with control systems. The structure diagram visually represents these components, highlighting their arrangement and interconnections for efficient operation.
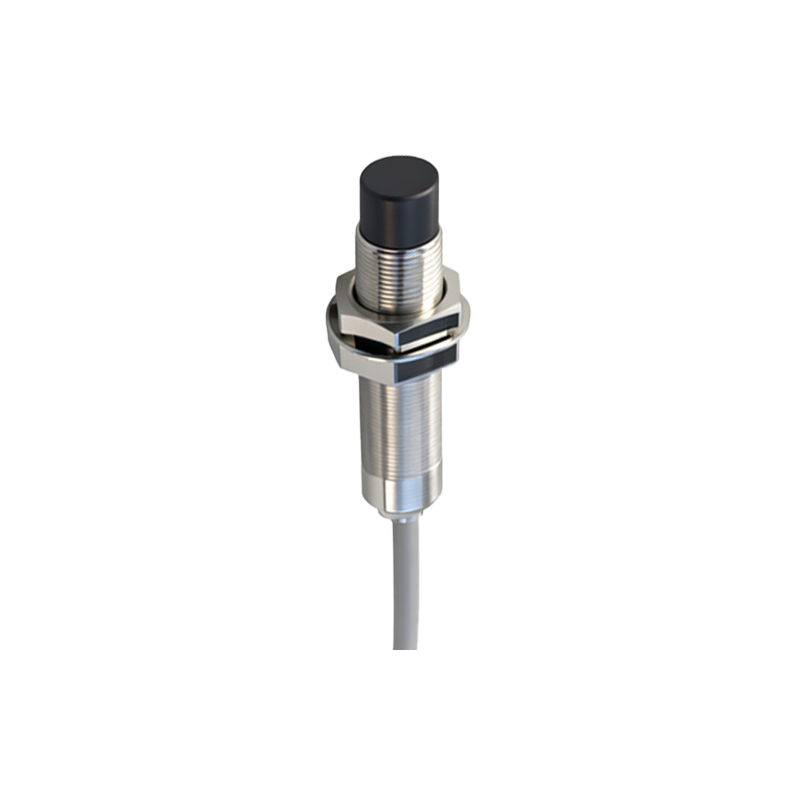
Emitter and Receiver Design Details
The emitter is responsible for generating the detection beam, with design choices impacting sensor range and accuracy. Common light sources include visible red, infrared, or laser LEDs, selected based on application needs like long-distance sensing or ambient light immunity. The emitter lens collimates the light into a narrow beam, enhancing directionality. On the receiver side, the photodetector converts incoming light into electrical current, with sensitivity adjusted through amplifier circuits. Filters may be incorporated to block unwanted wavelengths, reducing interference. In reflective-type sensors, the emitter and receiver are housed together, while through-beam types separate them for increased reliability.
Optical Path and Sensing Modes
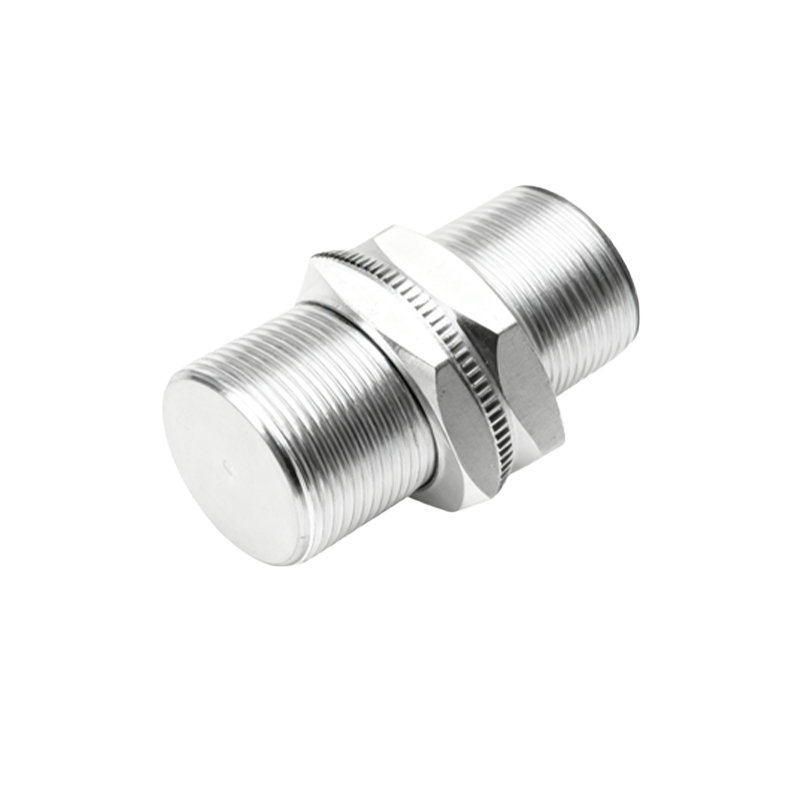
The optical path defines how light travels between the emitter, target, and receiver, influencing detection methods. Through-beam sensors use separate units, with the beam interrupted by objects, offering high accuracy over long distances. Retro-reflective sensors employ a reflector to bounce light back, suitable for medium-range applications. Diffuse reflective sensors rely on light scattering from the target itself, ideal for close-range detection. The structure diagram illustrates these paths, showing alignment angles and focal points. Advanced models may include background suppression features, using triangulation to ignore distant objects and improve targeting precision.
Circuitry and Signal Processing
Internal circuitry plays a crucial role in sensor functionality, comprising power supply units, amplification stages, and output drivers. The signal processor compares received light intensity to predefined thresholds, triggering digital or analog outputs when an object is detected. Noise reduction techniques, such as modulation of the light beam at specific frequencies, help distinguish signals from ambient light. The structure diagram often details these electronic components, including integrated circuits (ICs) and resistors, emphasizing their layout for thermal management and signal integrity. This ensures stable performance in industrial settings with electrical interference.
Housing and Environmental Protection
The housing design safeguards sensor components from external factors, with materials like stainless steel or plastic chosen for durability. Sealing standards, such as IP67 or IP69K, indicate resistance to water and dust ingress, critical for harsh environments. Mounting options, including brackets or threaded barrels, allow flexible installation. The structure diagram showcases these mechanical aspects, illustrating how seals, gaskets, and cable entries prevent damage. Additionally, housing shapes may incorporate optical windows or barriers to minimize crosstalk in multi-sensor setups, enhancing reliability in crowded machinery layouts.
Applications and Performance Considerations
Photoelectric proximity sensors are deployed across industries, from packaging lines to automotive assembly, due to their versatility. The structure diagram aids in selecting sensors based on range, response time, and environmental tolerance. For instance, high-speed applications require fast circuitry and focused beams, while outdoor use demands robust housing. Regular maintenance, such as lens cleaning, ensures longevity. By analyzing the diagram, engineers can troubleshoot issues like misalignment or component wear, optimizing sensor life and reducing downtime in automated systems.