Introduction to Photoelectric Sensing Thresholds
In industrial automation, the reliable detection of objects is paramount. Photoelectric sensors achieve this by emitting a light beam and measuring the amount of light returned to the receiver. The critical parameter determining a detection event is the sensor's threshold. This threshold is a pre-set value that the received signal must cross to trigger an output switch. Understanding and correctly applying threshold tables is not merely a theoretical exercise; it is a fundamental engineering practice that directly impacts system reliability, stability, and performance in diverse and often challenging environments.
Defining the Threshold and Its Role
The threshold is the demarcation line between a 'no object' state and an 'object present' state. When the received light intensity, often converted into an electrical signal percentage relative to a clear-state baseline, falls below (for diffuse or retro-reflective modes) or rises above (for through-beam mode) this set point, the sensor's output changes state. This threshold is not arbitrary. It is carefully calibrated by manufacturers to provide a buffer against signal noise, environmental fluctuations, and minor alignment shifts. A threshold set too sensitively may cause false triggers from dust, condensation, or vibration. Conversely, a threshold set too conservatively might fail to detect a valid object, especially if it has low reflectivity or is partially obscuring the beam.
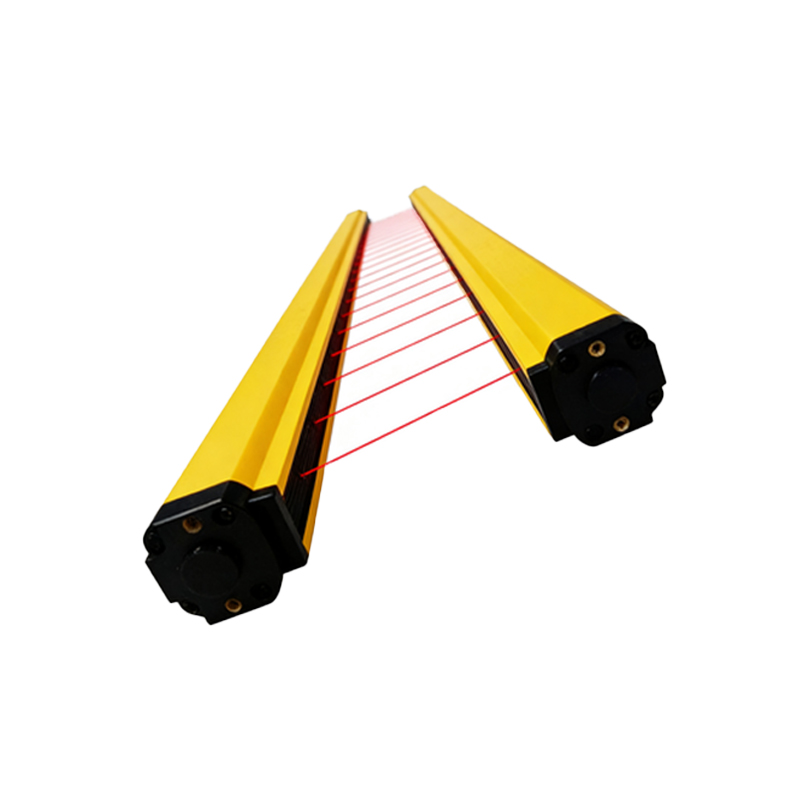
Components of a Comprehensive Threshold Table
A professional-grade photoelectric sensor datasheet will include a detailed threshold table or chart. This table is a multi-variable model that accounts for real-world conditions. Key parameters typically included are sensing distance, object properties, and environmental factors. The core of the table shows the stable detection zone, where the received signal strength is significantly higher than the threshold, ensuring robust operation. More importantly, it defines the uncertain zone or hysteresis band. This is a critical buffer area where detection may become unstable. The table also indicates the non-detection zone, where the signal is too weak to reliably cross the threshold. Engineers must design applications to keep the operating point firmly within the stable detection zone under all expected conditions.
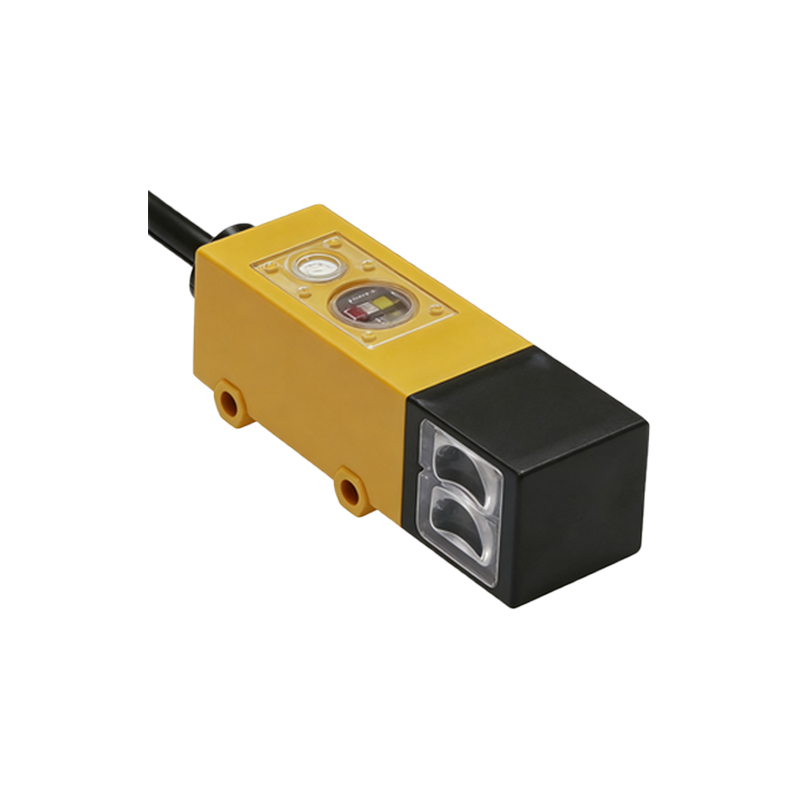
Interpreting Data for Different Sensing Modes
Threshold tables vary significantly by sensing mode. For a through-beam sensor, the table is often simpler, showing maximum operating distance based on emitter power and receiver sensitivity, with a high threshold for beam interruption. For retro-reflective sensors, the table must account for the reflectivity of the specific reflector tape or target used, as different grades can return vastly different signal percentages. The most complex tables are for diffuse reflective sensors. Here, the threshold table is a multi-dimensional chart correlating sensing distance, object size, and most critically, object surface reflectivity (often compared to a standard white Kodak card, which is defined as approximately 90% reflectivity). A dark, matte black object might have only 10% reflectivity, drastically reducing the effective sensing range compared to a white object.
Practical Application and Calibration
In practice, engineers use the threshold table during the sensor selection and system design phase. First, identify the worst-case object (smallest size, lowest reflectivity). Then, determine the required sensing distance. Cross-reference these values on the manufacturer's threshold diagram to ensure the operating point lies well within the stable detection zone, with a healthy safety margin. Many modern sensors feature teach-in functionality or potentiometers for threshold adjustment. After installation, it is best practice to perform a live calibration: present the actual object at the farthest and most oblique detection point, and set the threshold just above the received signal level for that condition. This empirical method accounts for installation-specific variables not covered in the generic table.
Environmental Factors and Compensation
Threshold tables are typically generated under controlled laboratory conditions. Real-world environments introduce contaminants like dust, oil mist, or steam that can attenuate the light beam. Temperature extremes can affect LED output and receiver sensitivity. Background light from sunlight or high-bay fixtures can flood the receiver. Advanced sensors incorporate features to combat these issues. Background light suppression uses modulated light to ignore constant ambient light. Temperature compensation circuits adjust internal gain. For highly contaminated environments, selecting a sensor with a high excess gain factor, as indicated in its threshold specifications, provides the necessary reserve signal strength to penetrate the medium and still reliably cross the detection threshold.
Conclusion: Thresholds as a Foundation for Reliability
Mastering the use of photoelectric sensor threshold tables is a hallmark of a proficient controls engineer. These tables translate the theoretical performance of a sensor into predictable, real-world behavior. They guide the selection of the correct sensor type and model for an application, inform proper installation practices, and underpin effective troubleshooting. By rigorously applying the data in these tables and understanding the principles behind them, engineers can design detection systems that are not just functional, but are robust, reliable, and capable of maintaining precision over the long term in demanding industrial settings. The threshold is the definitive line between signal and noise, and its intelligent management is the key to flawless automation.