Introduction to Proximity Sensor Schematics
Proximity sensor schematics are fundamental blueprints for electrical and automation engineers. These diagrams visually represent the electrical connections, components, and operational logic of sensors designed to detect the presence or absence of an object without physical contact. Understanding these schematics is crucial for proper sensor selection, circuit integration, troubleshooting, and system design. A typical schematic will detail power supply requirements, output signal types (e.g., NPN, PNP, analog), and connection points to controllers like PLCs. The ability to interpret these drawings allows engineers to ensure compatibility with existing systems, predict sensor behavior in a circuit, and diagnose faults efficiently, forming the backbone of reliable industrial automation.

Key Components in a Typical Schematic
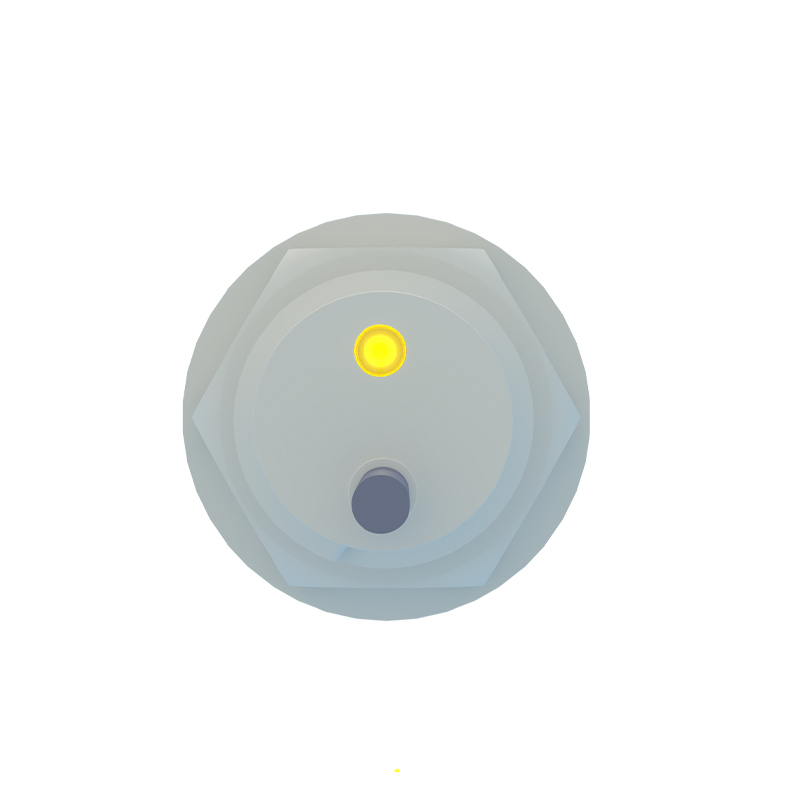
A standard proximity sensor schematic comprises several key symbols and notations. The core sensor element is often represented by a coil or a specific transducer symbol inside a circle or square, denoting the sensing face. Power terminals, usually labeled as V+ (or +Vcc) and V- (or 0V/GND), are clearly indicated. The output stage is critical; for a 3-wire DC sensor, the output transistor (NPN or PNP) is shown connected to the output wire (often black or blue). Protective components like reverse polarity protection diodes, surge suppression circuits, and status LEDs are also commonly illustrated. Familiarity with international standard symbols (IEC, ANSI) is essential for accurate interpretation across different manufacturer datasheets.
Interpreting Output Configurations: NPN vs. PNP
The output configuration is a central aspect of any proximity sensor schematic. Schematics distinctly show the difference between NPN (sinking) and PNP (sourcing) transistors. In an NPN schematic, the output transistor connects the load to common negative (0V); when activated, it "sinks" current to ground. Conversely, a PNP schematic shows the transistor connecting the load to positive voltage; it "sources" current to the load. The schematic will clearly mark the collector and emitter connections. Misinterpreting this can lead to incorrect wiring and system malfunction. Many modern schematics include a simplified truth table or logic diagram alongside the electrical drawing to clarify the switching behavior.
Wiring Diagrams and Connection Examples
Beyond the pure schematic, wiring diagrams provide practical connection guides. These illustrations show the sensor connected to a power source and a load, such as a PLC input module or a relay coil. For a 3-wire DC sensor, diagrams explicitly show: brown wire to +V, blue wire to 0V, and black wire to the PLC input. The PLC input's common point connection (sourcing or sinking) must match the sensor's output type. Schematics for 2-wire AC/DC sensors simplify this by showing the sensor in series with the load and power. Some advanced schematics also include wiring for sensors with complementary outputs (NO and NC) or analog output (0-10V, 4-20mA) configurations, detailing the signal wire connections.
Understanding Sensing Range and Field Diagrams
While not a traditional electrical schematic, the sensing range diagram is a vital companion illustration. Often presented as a side-view drawing, it defines the sensor's effective detection zone. Key parameters like nominal sensing distance (Sn), hysteresis, and repeatability are graphically represented. For inductive sensors, diagrams may show the reduction factor for different metals. For capacitive sensors, they might illustrate the influence of non-target materials. These diagrams, when cross-referenced with the electrical schematic, provide a complete picture of the sensor's operational envelope, ensuring proper mechanical mounting and avoidance of false triggers in the application layout.
Diagnostic Features and Indicator Circuits
Modern proximity sensor schematics increasingly include circuits for diagnostics and status indication. A common feature is a built-in LED indicator. The schematic shows how this LED is wired in parallel or series with the output circuit, indicating power presence and switching state. More advanced schematics detail short-circuit protection circuits, overload protection, and diagnostic output pins. For IO-Link or other smart sensors, the schematic becomes more complex, showing the communication interface chip, data lines, and additional power conditioning circuitry required for digital data exchange alongside the standard switching output.
Application-Specific Schematic Variations
Schematics vary significantly based on sensor technology and application. An inductive proximity sensor schematic focuses on the oscillator coil, demodulator, and Schmitt trigger circuit. A capacitive sensor schematic emphasizes the electrode plate and the sensitivity adjustment circuit. Ultrasonic sensor schematics detail the piezoelectric transmitter and receiver elements along with the timing circuit. Magnetic (reed or Hall effect) sensor schematics show the magnetically influenced switch or semiconductor element