Proximity sensors are fundamental components in modern industrial automation, providing non-contact detection of objects for control, counting, positioning, and safety applications. This article details a comprehensive experimental procedure to evaluate the key operational parameters of inductive and capacitive proximity sensors, which are among the most prevalent types in manufacturing and processing environments. The goal is to provide engineers and technicians with a practical framework for sensor validation, selection, and troubleshooting.
Experimental Objectives:
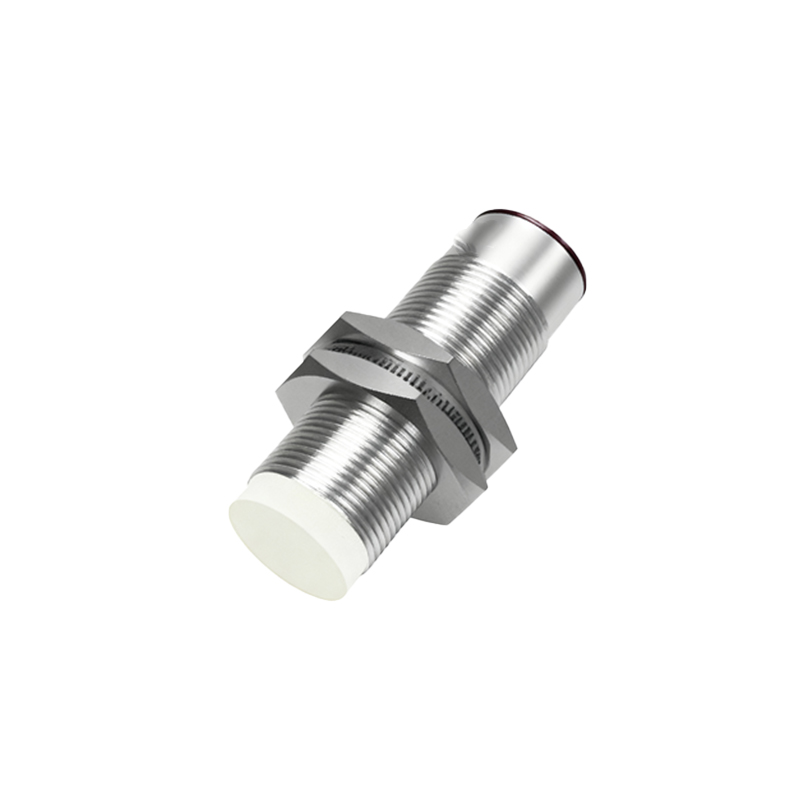
The primary objectives of this experiment are to quantitatively measure and analyze the following parameters for a given proximity sensor:
1. Nominal Sensing Distance (Sn): The theoretical operating distance under standardized conditions (typically with a standard target).
2. Effective Sensing Distance (Sr): The actual operating distance achieved in the real test setup, accounting for temperature, voltage, and target material.
3. Hysteresis (H): The difference between the switch-on point (as the target approaches) and the switch-off point (as the target recedes). This parameter is critical for preventing output oscillation.
4. Repeatability: The consistency of the switching point over multiple cycles of target approach and retreat.
5. Response Time: The time delay between the target entering the sensing field and the corresponding change in the sensor's output state.
Required Equipment:
Inductive Proximity Sensor (e.g., 12-24V DC, NPN normally open)
Capacitive Proximity Sensor (e.g., 12-24V DC)
Programmable Logic Controller (PLC) or a simple relay/indicator circuit with a DC power supply.
Calibrated Linear Positioning Stage (e.g., a micrometer screw gauge or a motorized slide with position feedback).
Standard Target (for inductive: a 1mm thick square of mild steel. For capacitive: the target material specified for the test).
Oscilloscope or high-speed data acquisition unit.
Digital Multimeter.
Various test targets (stainless steel, aluminum, copper, plastic, glass, liquid) for material influence tests.
Experimental Procedure:
Part A: Sensing Distance & Hysteresis Measurement
1. Mount the sensor securely on a stable base. Connect it to the PLC or indicator circuit and apply the rated voltage.
2. Attach the standard target to the linear positioning stage, ensuring it is aligned parallel to the sensor's sensing face.
3. Starting from a distance beyond the sensor's rated range, slowly move the target towards the sensor face using the positioning stage. Monitor the output indicator.
4. The exact position where the output switches from "OFF" to "ON" is the switch-on point. Record this distance (X_on).
5. Continue moving the target until it touches the sensor face, then slowly reverse direction.
6. The exact position where the output switches from "ON" back to "OFF" is the switch-off point. Record this distance (X_off).
7. Calculate the effective sensing distance (Sr) as (X_on + X_off) / 2.
8. Calculate the hysteresis (H) as X_on - X_off. This value is typically 3-10% of Sr and is a designed feature for stable switching.
9. Repeat this process 10 times to assess repeatability. Calculate the standard deviation of the switch-on point.
Part B: Material Influence Test
1. Repeat Part A, but replace the standard steel target with targets of different materials (aluminum, brass, plastic container with water).
2. For an inductive sensor, the sensing distance for non-ferrous metals will be significantly reduced. For a capacitive sensor, the sensing distance will vary with the dielectric constant of the material.
3. Tabulate the effective sensing distance (Sr) for each material. This data is crucial for application-specific sensor selection.
Part C: Response Time Measurement
1. Set up the target on a rapid actuator or quickly move the stage by hand to simulate a fast-approaching object.
2. Connect the sensor output signal to an oscilloscope channel. Use a second channel to monitor a trigger signal from the actuator or a simple contact indicating target movement start.
3. Initiate the target movement. The oscilloscope will capture the time delay between the trigger edge and the sensor output edge.
4. Measure the rise time (for switching ON) and fall time (for switching OFF). Typical values range from microseconds to a few milliseconds, as specified in the sensor datasheet.
Analysis and Discussion:
Compare the measured Sn and Sr values with the manufacturer's datasheet specifications. Discrepancies may indicate improper installation, voltage fluctuations, or environmental interference. Discuss the practical implications of hysteresis; insufficient hysteresis can cause