Proximity sensors are essential components in industrial automation, offering non-contact detection of metallic or non-metallic objects. Among various technical documents, the ring diagram (often referred to as a sensing range or detection zone diagram) is a critical tool for engineers to understand sensor performance and ensure proper installation. This guide explains how to interpret these diagrams accurately, following industry standards and practical applications.
A proximity sensor ring diagram typically consists of concentric circles or rings representing the sensor's sensing range, with annotations for key parameters. The central point usually denotes the sensor's active face, while the rings indicate distances at which the sensor can reliably detect objects. For inductive proximity sensors (common for metal detection), the diagram may show different rings for various materials, such as steel, aluminum, or copper, due to differences in material conductivity and permeability. Capacitive sensors, used for non-metallic materials, often include rings adjusted for dielectric constants.
To read the diagram, start by identifying the sensor type and its specifications, usually listed in a legend or table alongside the rings. Key elements include:
1. Sensing Range (Sn): This is the nominal detection distance, marked by the outermost ring under standard conditions (e.g., for a 10mm sensor, the ring might indicate 10mm from the face). It represents the ideal range where the sensor operates optimally, assuming a standard target material (like mild steel for inductive sensors).
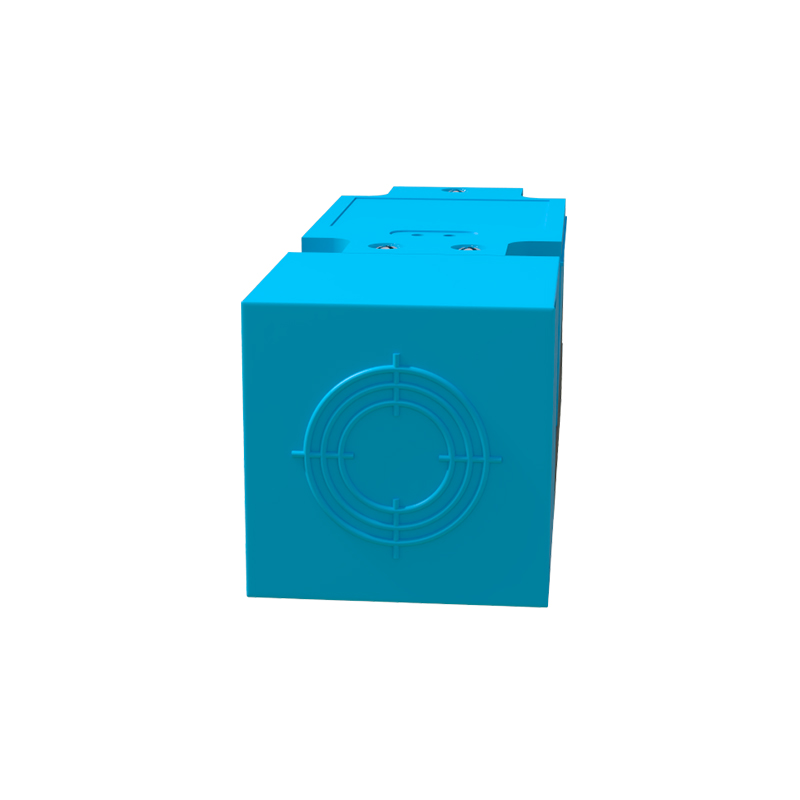
2. Reduction Factors: For non-standard materials, the diagram may include reduction coefficients (e.g., 0.5 for aluminum), meaning the effective sensing range is reduced. Engineers must multiply the nominal range by this factor to determine actual performance.
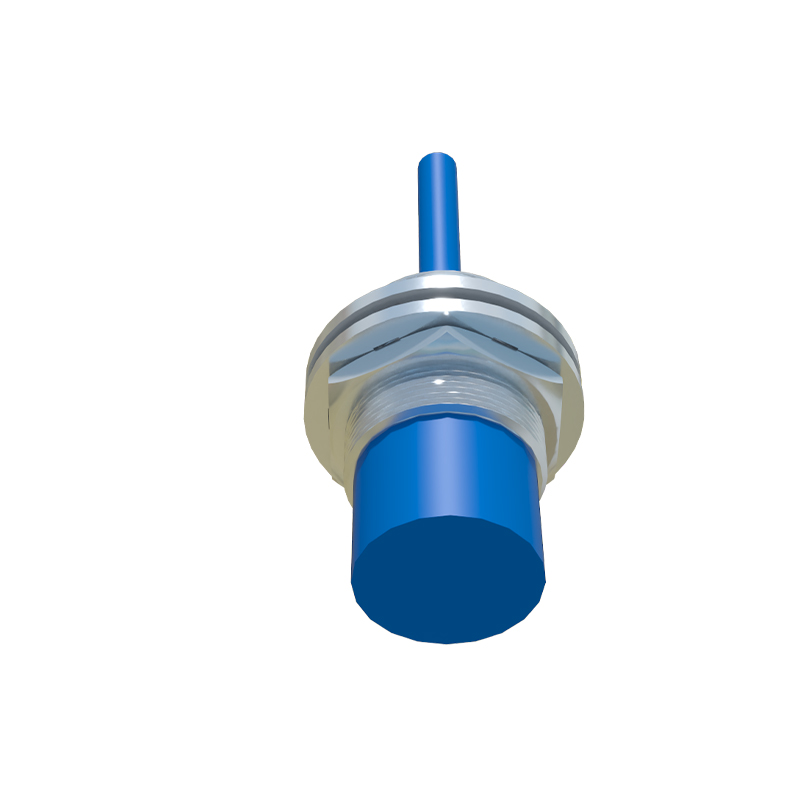
3. Hysteresis Zone: Some diagrams include an inner ring showing the hysteresis or reset distance—the point where the sensor turns off as an object moves away. This ensures stable switching and prevents chatter in dynamic environments.
4. Temperature and Voltage Effects: Advanced diagrams incorporate rings or notes on how sensing range varies with temperature fluctuations or supply voltage changes, often based on IEC 60947-5-2 standards. For instance, a sensor might have a reduced range at extreme temperatures, indicated by shaded rings.
5. Target Size and Orientation: Rings may be labeled with minimum object sizes (e.g., a square or circle diameter) for reliable detection. If the target is smaller than specified, the effective range shrinks, potentially causing false triggers. Diagrams sometimes include side-view rings to illustrate how sensing range extends laterally.

In practice, engineers use these diagrams to plan sensor placement in machinery. For example, when installing an inductive proximity sensor on a conveyor line, one would check the ring diagram to ensure the target metal parts pass within the nominal sensing ring, accounting for material type and environmental factors. Misreading the diagram can lead to installation errors, such as placing the sensor too far, resulting in missed detections, or too close, causing physical damage.
Additionally, ring diagrams help in troubleshooting. If a sensor fails to detect objects consistently, comparing actual distances to the diagram can reveal issues like material variations or interference from adjacent metals. For shielded sensors, the diagram might show a narrower, more focused sensing field, while unshielded sensors have broader rings that extend sideways, requiring careful spacing to avoid crosstalk.
Always refer to the manufacturer's documentation, as diagrams can vary by brand and model. Modern sensors may include digital ring diagrams in datasheets, with interactive tools to simulate conditions. By mastering ring diagram interpretation, engineers enhance system reliability, reduce downtime, and comply with safety standards in automation projects.
In summary, proximity sensor ring diagrams are visual aids that translate technical specs into actionable insights. Focus on the nominal sensing ring, adjust for materials and environment, and verify target alignment to ensure optimal performance in industrial applications.