In the field of industrial automation and electrical engineering, the ability to accurately represent components through diagrams is a fundamental skill. Among these components, proximity sensors are crucial for non-contact detection, and their schematic representation must be clear and standardized. This guide provides a detailed, step-by-step approach to drawing a square proximity sensor diagram, adhering to common industry conventions and ensuring technical clarity.
First, understand the purpose. A square or rectangular shape in a proximity sensor diagram typically represents the sensor's housing or physical body in a simplified 2D top or front view. It does not usually depict the internal electronics but rather the external form factor for integration into a larger system layout, such as a control panel drawing, a machine footprint plan, or a basic installation schematic.
Step 1: Define the Tools and Environment
Use professional computer-aided design (CAD) software like AutoCAD Electrical, EPLAN, or even standard drafting tools in software like Microsoft Visio or LibreOffice Draw. For quick sketches, a pencil, ruler, and eraser on graph paper work perfectly. The key is precision in line work.

Step 2: Draw the Basic Square Shape
Begin by drawing a perfect square. Using CAD tools, select the rectangle tool and hold the 'Shift' key to constrain proportions, or enter equal length and width dimensions (e.g., 20mm x 20mm is a common symbolic size). If drawing manually, use a ruler and a 90-degree angle to ensure all sides are equal and corners are sharp. The lines should be solid and of medium weight.
Step 3: Add the Sensor Face Indicator
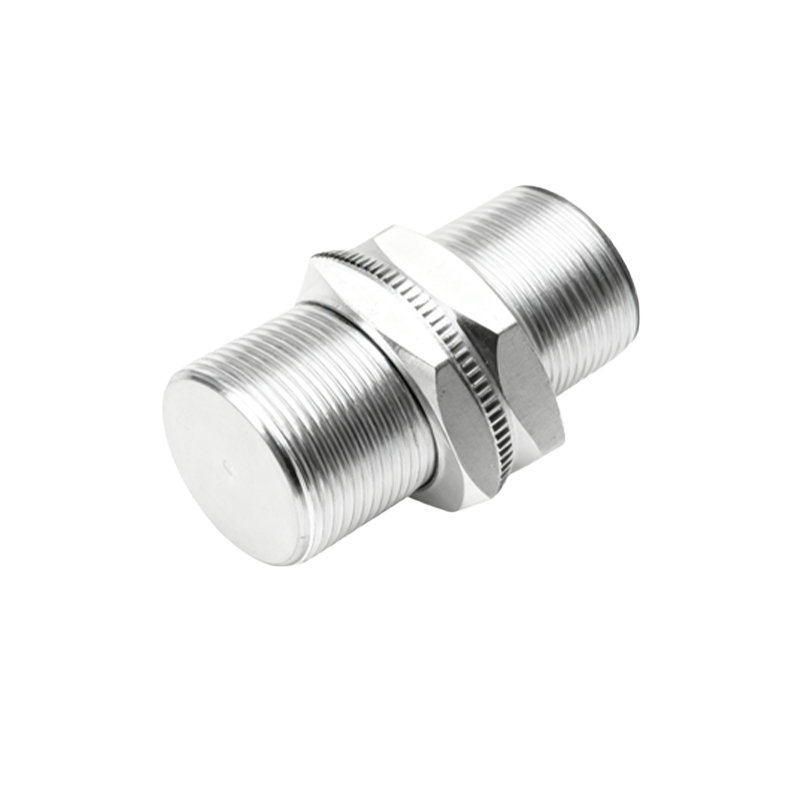
A proximity sensor detects objects at its face. To indicate this, draw a smaller, centered rectangle or a series of parallel lines (hatching) on one side of the square. This represents the sensing surface. Alternatively, two short, parallel lines extending perpendicularly from the center of one side are a widely recognized symbol for the active sensing area. Ensure this indicator is distinct.
Step 4: Incorporate Electrical Connections
Proximity sensors have electrical terminals. The standard method is to draw small circles or squares (terminal points) on the side opposite the sensor face. For a three-wire DC sensor (common for square types), draw three terminals in a row. Label them near the terminals: '+' for power supply (brown wire typically), '-' for ground (blue), and 'OUT' or 'NO/NC' for the switching signal (black). Use a clean font.
Step 5: Apply Standard Annotations and Symbols
Inside or adjacent to the square, add the standard IEC or ANSI symbol for a proximity sensor: a diamond shape with a bar on the sensing side. Often, this diamond is enclosed within the square. Also, add the letter code 'B' (for sensor) nearby if following IEC 61346 standards. Include a unique reference designator like 'B1' or 'PRX1' for identification in parts lists.
Step 6: Indicate Sensing Range and Field
To show functionality, draw a dashed line or a conical shape extending from the sensor face. This represents the effective sensing range or field. Annotate this with the nominal sensing distance (e.g., '5mm'). This is critical for layout planning to avoid collisions and ensure proper detection.
Step 7: Differentiate Sensor Type (Optional but Recommended)
To specify the sensor type, use standard symbols inside the square. For an inductive sensor (detects metals), add two horizontal loops (inductor symbol). For a capacitive sensor, draw two parallel lines separated by a gap. Photoelectric sensors might be shown with a Tx/Rx icon. This adds immediate technical clarity.
Step 8: Finalize with Labels and Notes
Outside the diagram, provide a title block or notes. Include the part number, manufacturer, supply voltage (e.g., 10-30V DC), output type (PNP/NPN, NO/NC), and the IP rating if relevant for the enclosure. Ensure all text is legible and aligned.
Best Practices for Industry Diagrams:
Consistency: Use the same line weights, text sizes, and symbol styles throughout your entire drawing set.
Layering: In CAD, use separate layers for the outline, symbols, text, and electrical connections for easy editing.
Simplicity: The diagram is a symbolic representation. Avoid over-detailing the physical appearance; focus on electrical and functional accuracy.
Standards Compliance: Adhere to relevant standards like IEC 60617, ANSI/IEEE 315, or your company's internal drafting standards.
By following these steps, engineers and technicians can create clear, professional, and universally understood diagrams of square proximity sensors. This facilitates better communication in