In the realm of industrial automation, precision measurement is paramount. Laser distance sensors have become indispensable tools, offering non-contact, high-accuracy solutions for a multitude of applications, from robotics and logistics to quality control and construction. While the core technology of time-of-flight or phase-shift measurement is well-understood, the user interface—specifically, the sensor display—plays a critical role in effective deployment, configuration, and troubleshooting. This guide delves into the functionalities, types, and best practices for interpreting and utilizing laser distance sensor displays from an engineering perspective.
The primary purpose of the display on a laser distance sensor is to provide real-time feedback and facilitate setup. Unlike a simple digital readout, modern sensor displays are interactive interfaces. The most fundamental information shown is the measured distance value, typically in millimeters, centimeters, or inches. However, a robust display will convey much more. Engineers should look for indicators showing the current operating mode (e.g., one-point measurement, continuous measurement, window mode), the status of the laser beam (on/off, safe Class 1 or 2 labeling), and the signal strength or quality. A weak signal indicator, often represented by a bar graph or specific icon, is crucial for diagnosing issues like poor surface reflectivity, environmental interference, or sensor misalignment.
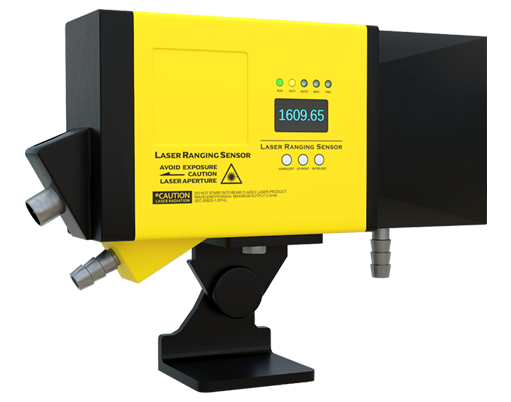
There are several common types of displays found on laser distance sensors. Basic models may feature a simple LCD digital screen showing only the numerical value. More advanced units incorporate graphical dot-matrix displays. These can show not only numbers but also menus, icons, bar graphs for signal strength, and even simple graphical representations of the measurement setup, such as showing the position of a measured point within a user-defined tolerance window. Some high-end or compact sensors may forgo a physical display altogether, relying instead on software configuration via a USB or Ethernet connection and using LED status lights (green, red, amber) to indicate power, readiness, or alarm conditions. In such cases, the "display" effectively becomes a PC-based interface.
Effective configuration via the display is key to optimal performance. Engineers must navigate the menu system to set parameters. Common settings accessible through the display include: measurement units, output configuration (analog 4-20mA, digital IO, serial data), and baud rate for communication. Critical functional setups involve defining measurement windows (setting upper and lower limits for valid measurements), configuring the response time or filtering to handle vibrating targets, and setting up switching outputs. For instance, a sensor on a sorting line can be configured via its display to trigger a reject mechanism only when a measured object's height falls outside a predefined window. The display will show the live measurement against these setpoints, allowing for real-time verification.
Troubleshooting using the display is an essential skill. A stable, flicker-free numerical reading usually indicates proper operation. An erratic reading, a display showing "----" or "Error," or a consistently low signal strength bar are immediate red flags. The display often provides error codes. Consulting the manual for codes like "E01" (signal too weak) or "E02" (signal too strong, saturation) directs the troubleshooting process. For weak signals, an engineer might check for dust, steam, or glossy/absorbent surfaces. The display can be used to monitor the signal strength while adjusting the sensor's angle or testing a different target surface. For communication errors, verifying the output and protocol settings on the display against the host system's expectations is the first step.
When selecting a laser distance sensor, the characteristics of its display should be a consideration alongside range and accuracy. For harsh environments, look for displays with high-brightness backlights for visibility in direct sunlight or protective covers against dust and liquids. The intuitiveness of the menu structure impacts setup time and reduces the potential for configuration errors. For applications where the sensor is mounted in a hard-to-view location, the availability of remote display options or software tools becomes a significant advantage.
In conclusion, the display on a laser distance sensor is far more than a simple output window. It is the central hub for interaction between the engineer and the sensor's sophisticated internal electronics. A deep understanding of its symbols, menus, and diagnostic capabilities empowers engineers to deploy these sensors with greater confidence, ensure measurement integrity, and maintain seamless integration within complex automated systems. By mastering this interface, one transforms raw distance data into actionable, reliable industrial intelligence.