Laser sensor bar graphs are a fundamental visualization tool used extensively across industrial automation, quality control, and process monitoring. These graphical representations, typically displayed on a sensor's integrated screen or a connected Human-Machine Interface (HMI), provide operators with immediate, intuitive feedback on measurement status. Unlike a simple numerical readout, a bar graph dynamically represents the relationship between the sensor's current measured value and its pre-configured thresholds, such as the sensing window or tolerance limits.
The core principle is straightforward. The bar graph consists of a scale, often representing distance, intensity, or a derived percentage, and a filled bar that extends proportionally to the measured value. When the target is within the optimal sensing range, the bar typically fills a central "GO" zone, often indicated in green. As the target moves closer to the upper or lower set limits, the bar extends into yellow warning zones. If the target value exceeds the acceptable thresholds, the bar will hit red alarm zones at either end of the scale. This color-coded, at-a-glance interpretation allows for rapid decision-making, reducing operator fatigue and error potential during high-speed or repetitive inspection tasks.
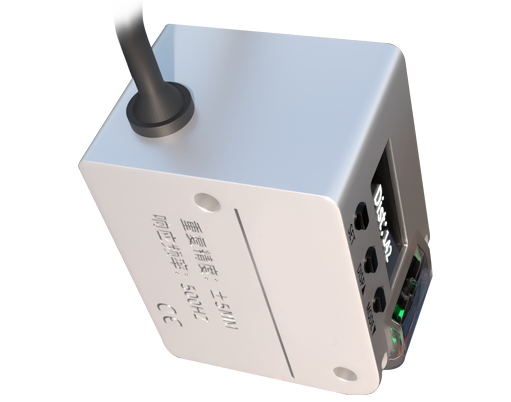
In practical applications, the utility of the laser sensor bar graph is immense. In assembly line positioning, for instance, a diffuse or through-beam laser sensor monitors the height of components. The bar graph instantly shows if a part is seated correctly (green zone), slightly misaligned (yellow), or missing entirely (red bar at minimum). Similarly, in width measurement using opposed sensors, the bar graph can represent the combined signal, providing immediate visual confirmation that material width remains within specification. For contrast sensors detecting labels or print marks, the bar graph visualizes the reflected light intensity, making it simple to set precise trigger points and diagnose weak signals caused by dirty lenses or fading marks.

Advanced laser sensors enhance this basic functionality with dual-bar graphs or segmented displays. A dual-bar graph might simultaneously show the current measured value and a reference or target value, allowing for direct comparison. Some models incorporate a "tolerance band" display, where a separate marker or shaded area represents the acceptable range, and a moving dot or shorter bar indicates the live measurement value within that context. This is particularly useful in calibration and setup phases, enabling technicians to quickly adjust sensor alignment or sensitivity until the live indicator is centered within the tolerance band.
The benefits of utilizing bar graph displays extend beyond operational ease. They are crucial for predictive maintenance. A gradual drift of the bar toward a warning zone over time can indicate lens contamination, declining laser diode output, or mechanical loosening of the sensor mount, prompting maintenance before a failure causes downtime. Furthermore, during system integration and debugging, the bar graph serves as a powerful diagnostic tool, helping engineers verify signal integrity and logical output behavior without needing a separate oscilloscope or data logger.
When selecting and applying laser sensors with bar graph features, engineers should consider the update rate of the display relative to the process speed. For very high-speed measurements, the bar graph might only provide an average or peak-hold indication. The resolution and scaling of the graph are also critical; a graph with too coarse a scale may not reveal small but significant process variations. Proper training for operators on interpreting the zones and responding to warnings is essential to fully leverage the technology.
In conclusion, the laser sensor bar graph is far more than a simple indicator. It is a critical interface element that translates raw analog or digital signals into actionable visual information. By providing immediate contextual understanding of a measurement within its operational boundaries, it enhances accuracy, speeds up response times, and contributes significantly to overall system reliability and efficiency in modern industrial environments. Its continued evolution, integrating with larger visualization systems and data analytics platforms, ensures it will remain a staple in the instrumentation and control landscape.