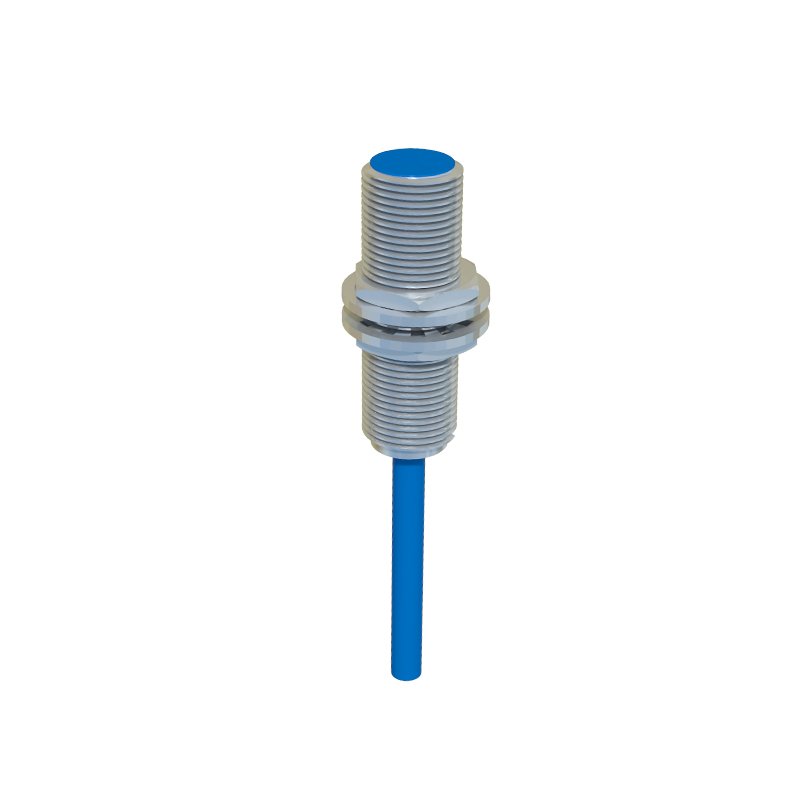
In the realm of industrial automation and control systems, proximity switch pressure sensors are pivotal components. Their functionality, however, is often best understood not just through technical specifications, but through detailed visual analysis. This article provides a comprehensive visual guide to these sensors, catering to the needs of electrical engineers, maintenance technicians, and system integrators.
A high-resolution image of a standard inductive proximity switch reveals its robust, typically cylindrical metal housing. The threaded barrel design, often in M8, M12, M18, or M30 sizes, is clearly visible, emphasizing its suitability for mounting in drilled holes on machinery. The sensing face, a flat or slightly rounded surface at the tip, is a critical visual element; its material and condition directly affect sensing range and reliability. Accompanying this image should be a diagram showing the internal components: the oscillator coil, demodulator, and output switching circuit. This cross-section view demystifies the principle of operation, where a metallic target entering the electromagnetic field induces eddy currents, causing the oscillator to dampen and trigger the output state change.
Moving to pressure sensor imagery, a stark contrast in design philosophy is evident. A typical piezoresistive pressure sensor image showcases a compact, often rectangular or disc-shaped housing with a pressure port—a threaded (e.g., G1/4) or flanged connection point. The diaphragm, though internal, is the heart of the device. An illustrative cutaway diagram is indispensable here, displaying the thin silicon diaphragm with implanted strain gauges arranged in a Wheatstone bridge configuration. The visual stress distribution on the diaphragm under applied pressure, often shown with color gradients (blue for low stress, red for high stress), powerfully conveys the transduction principle. Another crucial image set depicts different sensing technologies side-by-side: a capacitive pressure sensor with its dual-plate design versus the piezoelectric sensor's crystal element. These comparative visuals highlight trade-offs in sensitivity, stability, and suitability for dynamic versus static pressure measurements.
Integration is where the application becomes clear. A well-composed photograph of a hydraulic or pneumatic system control panel is highly instructive. It shows a proximity switch mounted on a cylinder to detect piston position, with its LED status indicator glowing. Nearby, a pressure sensor is installed inline via its port, with electrical connections routed to a programmable logic controller (PLC). Wiring diagrams superimposed on such photos, or presented separately, are invaluable. They detail the standard 3-wire (PNP/NPN) DC configuration for proximity switches (brown/+V, blue/0V, black/signal) and the 4-wire (excitation +/- and signal +/-) or fieldbus connections for pressure sensors. A screenshot from a Human-Machine Interface (HMI) or SCADA system displaying real-time pressure waveforms and switch status logs ties the visual narrative together, linking the physical device state to system data.
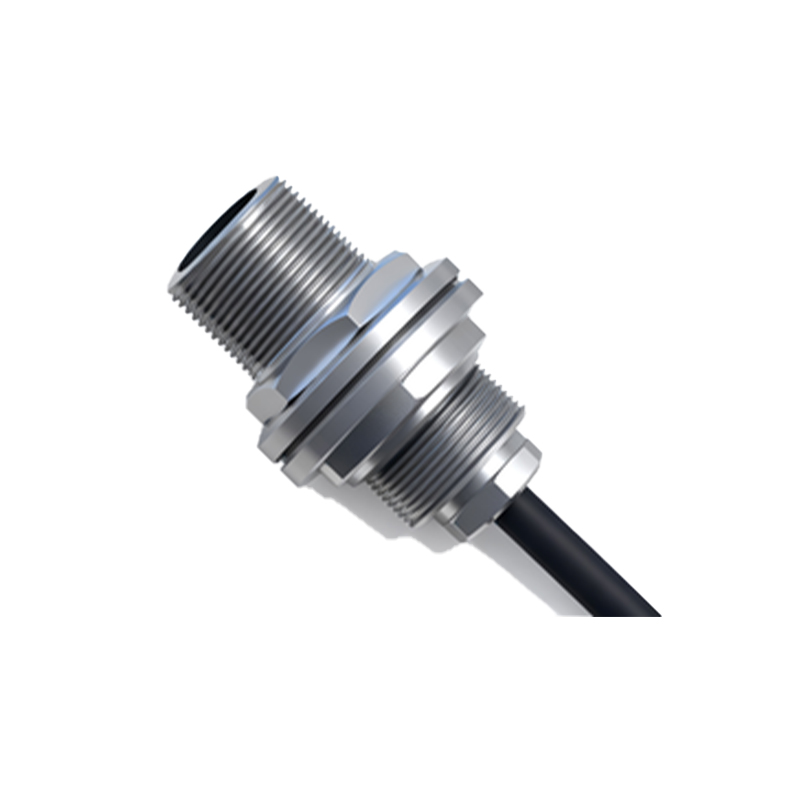
Diagnostic imagery is equally vital for engineers. A macro photograph comparing a clean, undamaged sensing face with one contaminated by metal shavings, oil, or physical pitting immediately underscores maintenance priorities. For pressure sensors, images illustrating common failure modes—such as a ruptured diaphragm, clogged pressure port, or moisture ingress in the connector—serve as a rapid diagnostic aid. Thermal imaging pictures can also be insightful, showing abnormal heat generation in a sensor or its associated wiring due to overcurrent or short circuits.
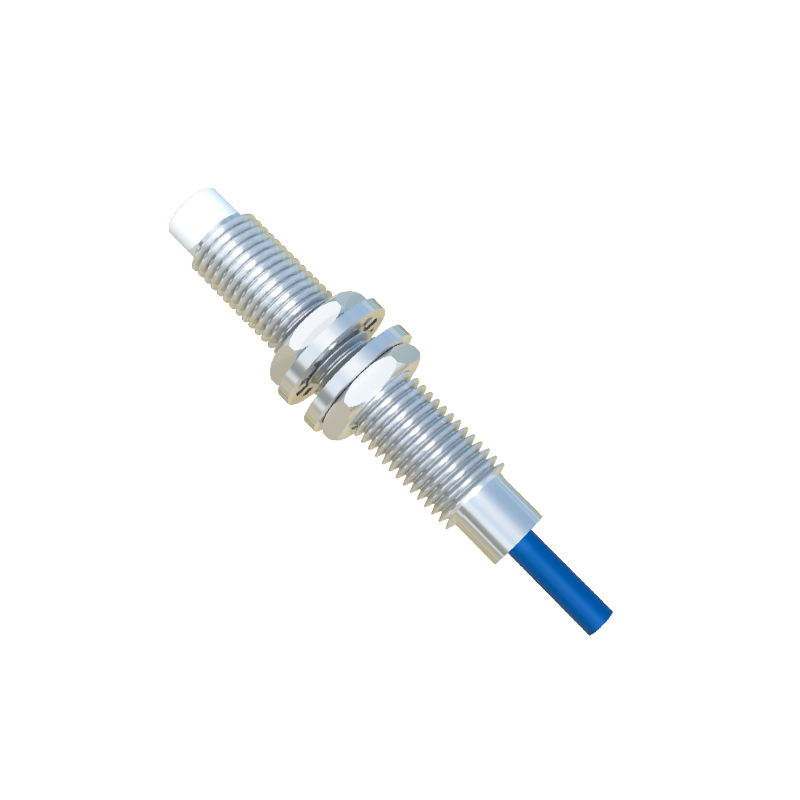
Finally, technical documentation images, such as datasheet excerpts focusing on characteristic curves, are essential visual tools. A graph plotting sensing distance versus target material (steel, aluminum, brass) for a proximity switch provides immediate application guidance. For pressure sensors, a visual plot of output voltage versus applied pressure, indicating linearity, hysteresis band, and temperature drift effects, conveys performance parameters more intuitively than text alone. Diagrams illustrating mounting considerations, like the importance of maintaining a flush installation for proximity switches or avoiding mechanical stress on the pressure port, prevent common installation errors.
In conclusion, a systematic library of proximity switch and pressure sensor images—from anatomy and integration to diagnostics and data curves—forms a powerful knowledge base. It bridges the gap between abstract theory and practical application, enabling faster design, troubleshooting, and optimization of automated systems. Engineers are encouraged to build and reference such visual resources as a standard practice in their technical workflow.