Photoelectric sensor proximity switches are essential components in modern industrial automation, offering non-contact detection capabilities for various applications. These devices operate by emitting a light beam—typically infrared, visible red, or laser—and detecting changes in the received light to sense the presence, absence, or position of an object. Understanding the internal diagram and working principle is crucial for engineers and technicians to ensure optimal performance and troubleshooting.
A standard photoelectric sensor proximity switch consists of several key components illustrated in its diagram. The emitter section contains a light source, such as an LED or laser diode, driven by a constant current circuit to maintain stable output. The receiver section includes a phototransistor, photodiode, or integrated receiver IC that converts incoming light into an electrical signal. Between these, optical elements like lenses or apertures focus the emitted beam and collect reflected or transmitted light. The control circuitry processes the receiver's signal, comparing it to a threshold to determine the object's presence, and outputs a switch signal—typically via a transistor (NPN/PNP) or relay. Many diagrams also show sensitivity adjustment potentiometers, indicator LEDs, and wiring terminals for power supply (usually 10-30V DC) and load connection.
There are three primary operating modes depicted in functional diagrams. The through-beam (opposed) mode uses separate emitter and receiver units; an object is detected when it interrupts the light beam. The retro-reflective mode employs a single housing with both emitter and receiver, along with a reflector; detection occurs when the object blocks the reflected beam. The diffuse (proximity) mode relies on light reflected directly from the target, with sensitivity adjusted for specific reflectivity and distance. Advanced diagrams may include background suppression techniques or time-of-flight measurement for precise ranging.
When interpreting a photoelectric sensor diagram, pay attention to timing charts showing response times, which can be as fast as milliseconds, and hysteresis curves that prevent output chattering. Wiring diagrams indicate correct connections: brown wire for DC+, blue for DC-, black for output signal, and sometimes white for control input. Environmental considerations like ambient light immunity, IP ratings for dust/water resistance, and temperature ranges are often noted. For installation, diagrams suggest mounting positions to avoid misalignment, lens cleaning procedures, and minimum/maximum sensing distances based on target properties.
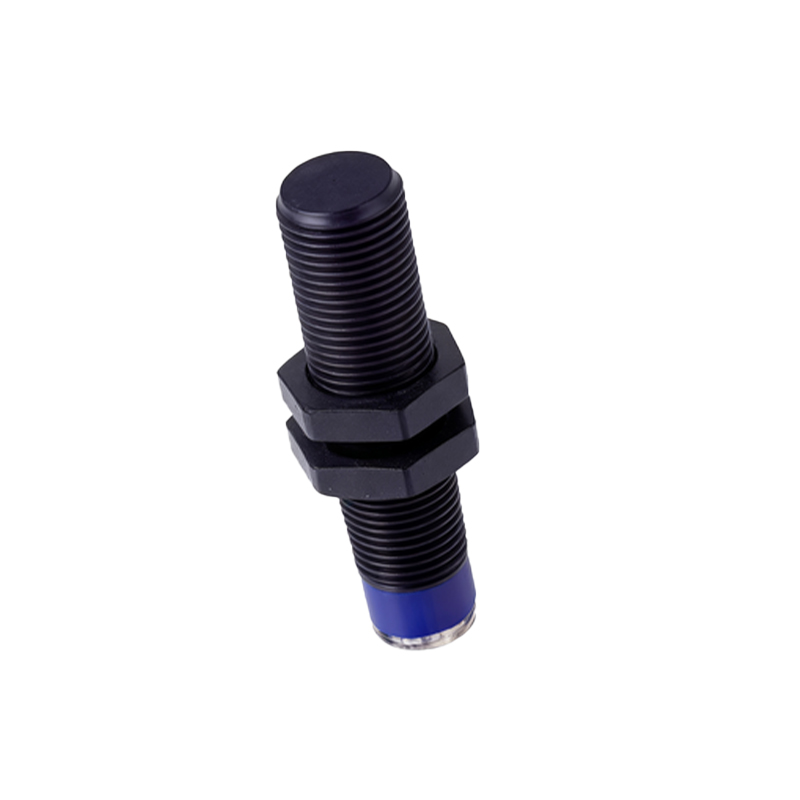
Common applications illustrated include object counting on conveyor belts, jam detection in packaging machinery, level sensing in silos, and position verification in robotic arms. Regular maintenance involves checking lens cleanliness, verifying alignment, and testing output stability under varying conditions. Troubleshooting using the diagram might involve measuring voltage at test points, adjusting sensitivity, or replacing faulty optical components. By mastering the photoelectric sensor proximity switch diagram, professionals can enhance system reliability, reduce downtime, and adapt sensors to complex automation challenges efficiently.