In the realm of industrial automation and process control, proximity sensors are indispensable components, providing non-contact detection of objects and ensuring seamless operations. Among various diagnostic indicators, the "hourglass" display symbol on sensor interfaces or connected HMI/SCADA systems has become a critical, yet often misunderstood, signal. This article delves into the technical nuances of hourglass display indications specifically related to proximity sensor anomalies, exploring their causes, implications, and systematic troubleshooting approaches.
The hourglass icon, traditionally symbolizing a "wait" or "processing" state in computing, when observed in an industrial sensor context, typically indicates a communication delay, a processing overload within the sensor's internal circuitry, or an impending fault condition. Proximity sensors, whether inductive, capacitive, or photoelectric, rely on precise oscillatory circuits, microprocessors, and communication protocols. An hourglass display often manifests when the sensor's internal diagnostic routine detects parameters drifting beyond nominal thresholds but before a definitive hard fault is declared.
Several root causes can trigger this anomalous display. First and foremost is electrical noise and interference. Industrial environments are rife with electromagnetic interference (EMI) from variable frequency drives (VFDs), welding equipment, or heavy machinery. This noise can couple onto sensor signal lines or power supplies, corrupting data packets in networked sensors (e.g., IO-Link, PROFINET) or causing the sensor's microcontroller to enter error-correction cycles, symbolized by the hourglass. Inadequate shielding, improper grounding, or running sensor cables parallel to high-power lines are common culprits.
Secondly, supply voltage irregularities are a prime suspect. Proximity sensors have specified operational voltage ranges (e.g., 10-30V DC). Brownout conditions (voltage sag), transients, or ripple on the DC supply can cause the sensor's power regulation circuit to struggle, leading to intermittent microprocessor resets or communication timeouts. The hourglass may appear during these unstable power events as the sensor attempts to stabilize and re-establish normal operation.
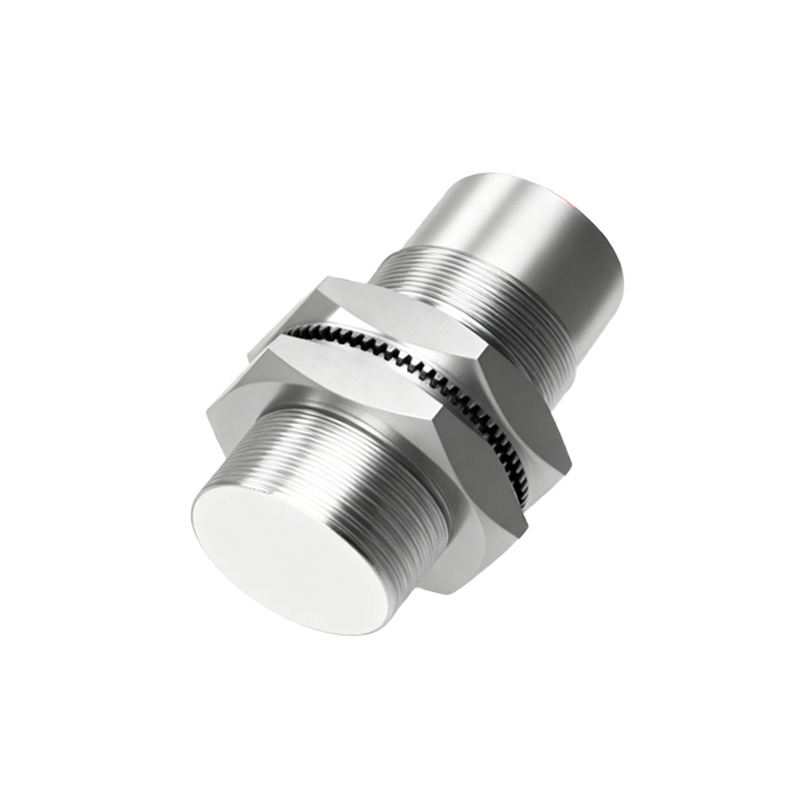
Third, sensor overload or environmental stress can induce this state. Exceeding the sensor's maximum switching frequency for an extended period, operating at temperatures beyond its rated specification, or exposure to contaminants like metallic dust (for inductive sensors) or condensation can force the sensor into a protective diagnostic mode. The internal firmware continuously monitors temperature, oscillation amplitude, and output current. Anomalies in these readings may initiate a prolonged self-check, indicated by the hourglass, before potentially locking out or triggering a failure alarm.
Another critical area involves configuration and network issues. For smart sensors with configurable parameters, an incomplete or corrupted parameter download from a controller can leave the sensor in an ambiguous state. In networked systems, high network traffic, incorrect node addressing, or mismatched baud rates can cause communication latencies. The sensor, waiting for a valid configuration or a response from the master controller, may display an hourglass icon on a connected diagnostic tool.
Troubleshooting an hourglass display requires a methodical approach. Begin with a visual and environmental inspection: check for physical damage, contamination, or excessive ambient temperature. Verify the installation, ensuring proper sensing distance and the absence of vibration that could cause intermittent detection.
Next, conduct electrical measurements. Use a true-RMS multimeter to measure the supply voltage at the sensor's terminals under load, checking for sags, noise, or incorrect polarity. Employ an oscilloscope to inspect the quality of the DC supply and the sensor's output signal for noise superposition. Ensure grounding integrity; a star-point grounding scheme is often recommended for sensitive devices.
For networked sensors, utilize diagnostic software. Access the sensor's parameter page via the engineering tool (e.g., Siemens TIA Portal, Rockwell Studio 5000, or vendor-specific software). The software often provides detailed error logs or status words that clarify the meaning behind the hourglass symbol. It might indicate "Busy processing parameter change," "Communication timeout," or "Internal diagnostic in progress."
Simple corrective actions include power cycling the sensor to clear a temporary software glitch, checking and reseating all electrical connections, and relocating or properly shielding cables away from noise sources. Installing a line filter or a dedicated, stabilized power supply for the sensor circuit can resolve voltage-related issues. For configuration problems, re-downloading the correct parameter set or resetting the sensor to factory defaults may be necessary.
Preventive maintenance is key to avoiding recurrent anomalies. Establish regular schedules for inspecting sensor cleanliness, verifying electrical connections, and monitoring supply voltage stability. Implementing EMI mitigation strategies, such as using shielded twisted-pair cables and ferrite cores, during initial installation pays long-term dividends in reliability.
In conclusion, the hourglass display on a proximity sensor is not a failure per se but a vital pre-fault diagnostic indicator. It represents the sensor's intelligent response to sub-optimal