Safety proximity sensors are integral components in modern industrial automation systems, designed to detect the presence or absence of objects without physical contact, thereby ensuring operational safety. Among various documentation tools, the square diagram—often referred to as a function block or logic diagram—serves as a critical blueprint for understanding sensor functionality, wiring, and integration within safety circuits. This article delves into the structure, interpretation, and application of safety proximity sensor square diagrams, tailored for engineers and technicians in the electrical and automation fields.
A square diagram typically represents a safety proximity sensor as a functional block with standardized symbols and notations. Each side or section of the square corresponds to specific electrical connections or operational parameters. For instance, the diagram may include input terminals for power supply (e.g., 24V DC), output signals (such as PNP or NPN transistor outputs), and diagnostic feedback lines. Key elements often depicted are the sensor's detection range, response time, and safety ratings (e.g., SIL 2 or PL d according to IEC 61508 and ISO 13849 standards). Understanding these symbols is essential for proper installation and troubleshooting, as misinterpreting the diagram can lead to system failures or safety hazards.
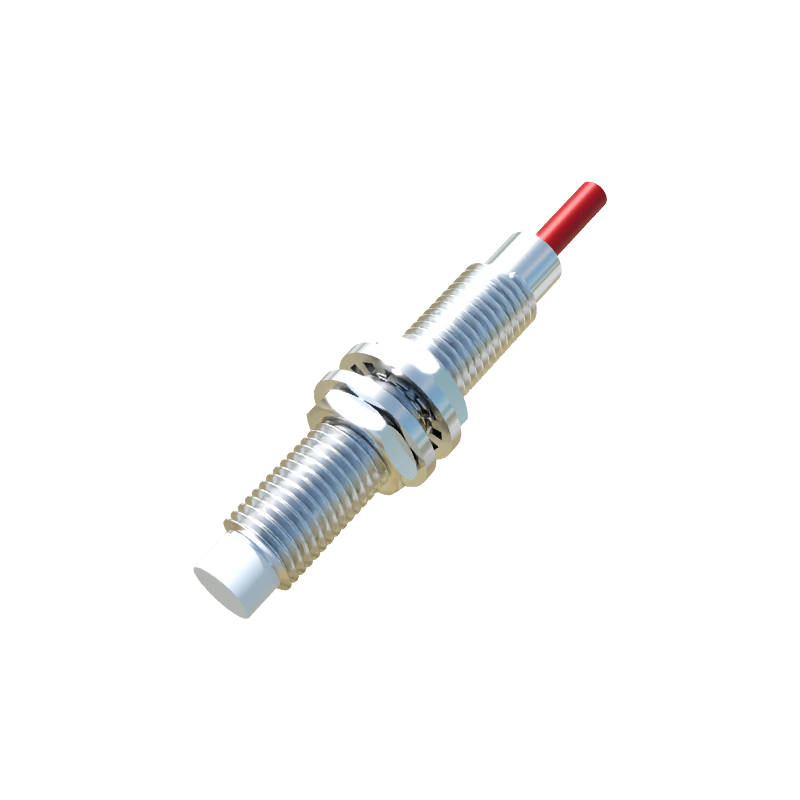
In practice, safety proximity sensors are deployed in hazardous areas where machinery movement poses risks to personnel. The square diagram aids in configuring these sensors within safety relay circuits or programmable logic controllers (PLCs). For example, a common setup involves connecting the sensor's output to a safety relay's input channel, with the diagram illustrating how the sensor's normally open (NO) or normally closed (NC) contacts interact with the relay logic. This ensures that if an object enters a restricted zone, the sensor triggers an immediate shutdown signal, preventing accidents. Engineers must verify that the diagram aligns with the sensor's datasheet, noting parameters like operating voltage, current consumption, and environmental tolerances (e.g., IP67 rating for dust and water resistance).
Moreover, square diagrams facilitate compliance with international safety regulations. They provide a visual reference for auditing and validation processes, demonstrating that safety loops are designed to meet required performance levels. When integrating multiple sensors—such as in a light curtain or area scanning system—the diagrams help map interconnections, ensuring redundancy and fault detection. For instance, a dual-channel safety sensor might show separate blocks for each channel, highlighting cross-monitoring features to detect internal faults. This redundancy is crucial for maintaining system integrity even if one component fails.
To effectively utilize square diagrams, professionals should follow best practices. Start by reviewing the manufacturer's documentation, as symbols can vary between brands like Sick, Omron, or Banner Engineering. Use the diagram to plan wiring layouts, avoiding interference from electromagnetic noise or mechanical stress. During commissioning, test the sensor's response against the diagram's specifications, using multimeters or oscilloscopes to verify signal integrity. Regular maintenance checks should reference the diagram to identify wear or misalignment, which could degrade safety performance.
In summary, safety proximity sensor square diagrams are indispensable tools for designing and maintaining safe industrial environments. They encapsulate complex technical details in an accessible format, enabling precise implementation of safety functions. As automation evolves with trends like Industry 4.0 and IoT connectivity, these diagrams will continue to adapt, incorporating digital interfaces and smart diagnostics. By mastering their interpretation, engineers can enhance system reliability, reduce downtime, and most importantly, protect human lives in high-risk operations. Always prioritize training on diagram literacy and stay updated with industry standards to leverage these sensors effectively.