In industrial automation and control systems, proximity sensors are fundamental components for non-contact detection of objects. A critical performance parameter, often scrutinized during system design, troubleshooting, and validation, is the switching frequency. This metric, typically expressed in Hertz (Hz), defines the maximum number of detection cycles (ON/OFF operations) a sensor can perform per second. Accurate measurement and understanding of this frequency are paramount for ensuring system reliability, preventing missed counts, and optimizing high-speed processes.
The switching frequency specification, found on every sensor datasheet, represents a theoretical maximum under ideal laboratory conditions. Real-world performance, however, can be significantly influenced by several factors. These include the target material (steel, aluminum, brass, etc.), target size (relative to the sensor's active face), the approach speed and direction of the target, and the electrical characteristics of the load and power supply. A sensor rated for 2 kHz might only achieve 1.5 kHz when detecting a small aluminum target at an oblique angle, for instance. Therefore, verification through measurement is often necessary.
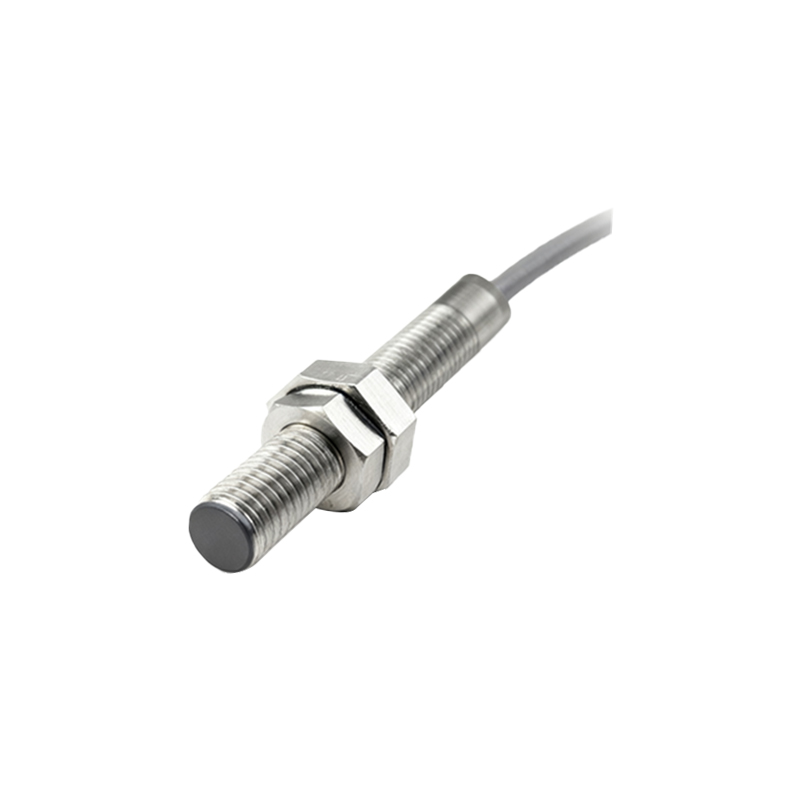
The core principle of measurement involves subjecting the sensor to a repetitive, controlled detection event and monitoring its digital output signal. The standard setup requires a rotating disk, often made of metal with precisely machined tabs or holes, mounted on a variable-speed motor. The sensor is positioned so that the tabs pass through its sensing field. As each tab enters and exits the field, the sensor's output switches. The frequency of this output switching is then measured.
For engineers, the choice of measurement instrument is crucial. While a simple digital oscilloscope is the most common and versatile tool, other instruments can be employed:
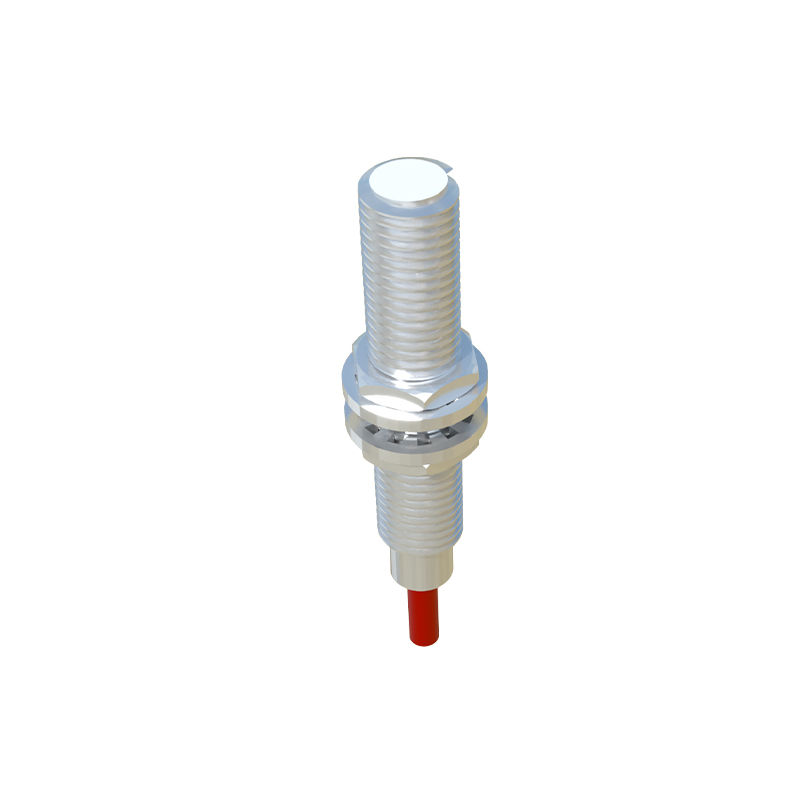
1. Digital Oscilloscope: This is the preferred method. It allows direct visualization of the output waveform. Engineers can connect the probe to the sensor's output signal wire (typically the black wire for NPN/PNP switching outputs). The key is to trigger on the rising or falling edge and use the oscilloscope's frequency measurement function. More importantly, the oscilloscope reveals the signal's quality—rise time, fall time, overshoot, and any bouncing or noise—which directly impacts effective switching capability. A clean, square wave with fast transitions indicates the sensor is operating within its limits.
2. Frequency Counter: A dedicated frequency counter provides highly accurate numerical readings but offers no insight into the waveform shape. It is suitable for final verification when signal integrity is already confirmed.
3. PLC High-Speed Counter Module: In a system integration context, using the plant's Programmable Logic Controller (PLC) with a high-speed counter input is a practical, application-oriented test. It measures the frequency as the control system would actually "see" it, factoring in input filtering and scan time effects.
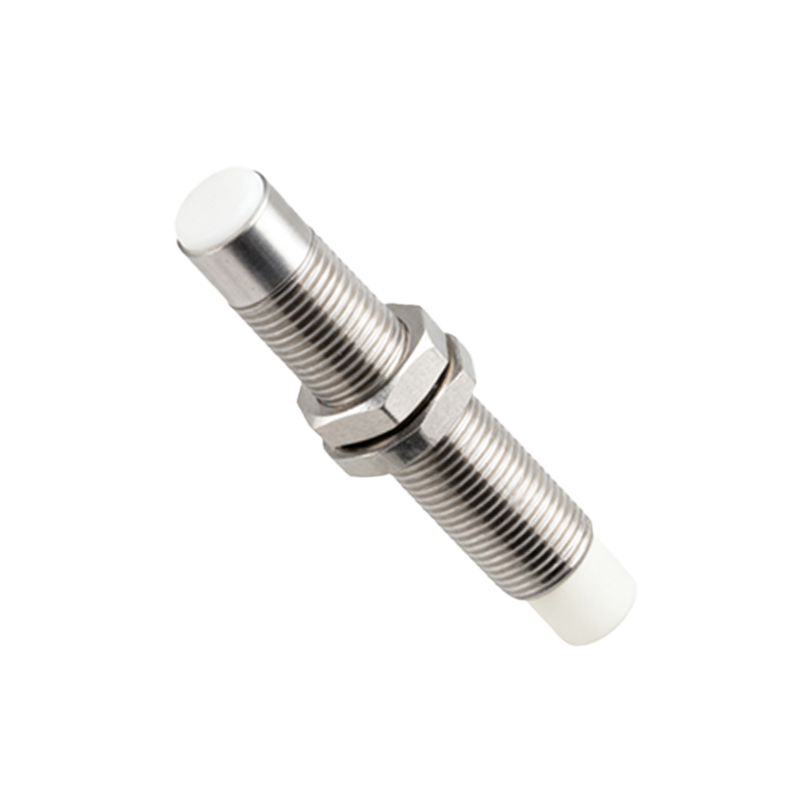
The measurement procedure follows a systematic approach. First, ensure stable DC power supply (e.g., 24V DC) to the sensor, within its specified range. Connect the measurement instrument across the sensor's output and common. Start the motor at a low speed and observe the signal. Gradually increase the rotational speed of the disk. The switching frequency increases linearly with rotational speed. The critical point is reached when the sensor's output can no longer reliably follow the passing of the tabs. Signs of failure include a distorted waveform (rounded edges), reduced amplitude, or missed pulses (the output remains high or low despite a tab passing). The maximum frequency before these failures occur is the effective switching frequency for that specific test setup.
Interpreting the results requires context. The measured value must be compared against the datasheet specification, acknowledging the test conditions. A lower-than-expected frequency might not indicate a faulty sensor but could point to:
Insufficient Target Size: The target should meet or exceed the sensor's stated "standard target" (usually a square of mild steel of a defined size).
Electrical Load Issues: Inductive loads (like relays, solenoids) can cause voltage spikes that interfere with switching. Always test with the specified load or a suitable equivalent.
Power Supply Noise or Instability: Ripple on the DC supply line can impair performance.
Sensor Misalignment or Mounting: Non-ferrous materials in the mounting background or improper alignment can weaken the sensing field.
For high-frequency applications, such as packaging machinery, small parts assembly, or rotary encoders, pushing the sensor to its limits is common. Here, engineers must consider not just the nominal frequency but also the sensor's response time (the sum of the ON-delay and OFF-delay). The reciprocal of the total response time gives a more conservative estimate of the usable frequency. For example, a sensor with a 0.1 ms ON-delay and 0.2 ms OFF-delay has a total response time of 0.3 ms