In the realm of industrial automation, laser sensors have become indispensable tools for precise position detection. A laser sensor position detection diagram is a critical visual and technical document that illustrates how a laser sensor system identifies, measures, and verifies the location of an object within a defined space. This diagram is not merely a schematic; it is a comprehensive blueprint that integrates optical principles, electronic signal processing, and mechanical integration to ensure operational accuracy and reliability.
The core of such a diagram typically depicts the laser emitter, the target object, and the receiver or detector. The emitter projects a focused laser beam—often visible or infrared—towards the target. Upon striking the object's surface, the beam is reflected, diffused, or interrupted. The receiver then captures this altered light signal. The key parameters illustrated include the sensing distance, the spot size of the laser beam at the target, the angle of incidence, and the receiver's field of view. Advanced diagrams will also detail the detection method: through-beam, retro-reflective, or diffuse-reflective. A through-beam system shows separate emitter and receiver units, with detection triggered by beam interruption. A retro-reflective diagram includes a reflector, showing the beam returning to a combined emitter/receiver unit. A diffuse-reflective diagram illustrates the sensor relying on light scattered directly back from the object itself.
Crucially, the diagram annotates the detection zone and any potential dead zones. It defines the precise point where the sensor's output signal switches state, indicating "object present" or "object absent." This switching point is often tied to a specific threshold in the received light intensity or time-of-flight measurement. For time-of-flight (ToF) laser sensors, the diagram visually represents the principle of calculating distance based on the time delay between the emitted pulse and the received reflection.
Electrical interfaces and output signals are also represented. This may show the connection to a Programmable Logic Controller (PLC), with digital (PNP/NPN) or analog (4-20mA, 0-10V) output lines graphically linked to the sensor symbol. The diagram might include timing charts showing the relationship between the object entering the detection field, the sensor's response time, and the resulting output signal pulse. This is vital for synchronizing the sensor with high-speed production lines or robotic pick-and-place operations.
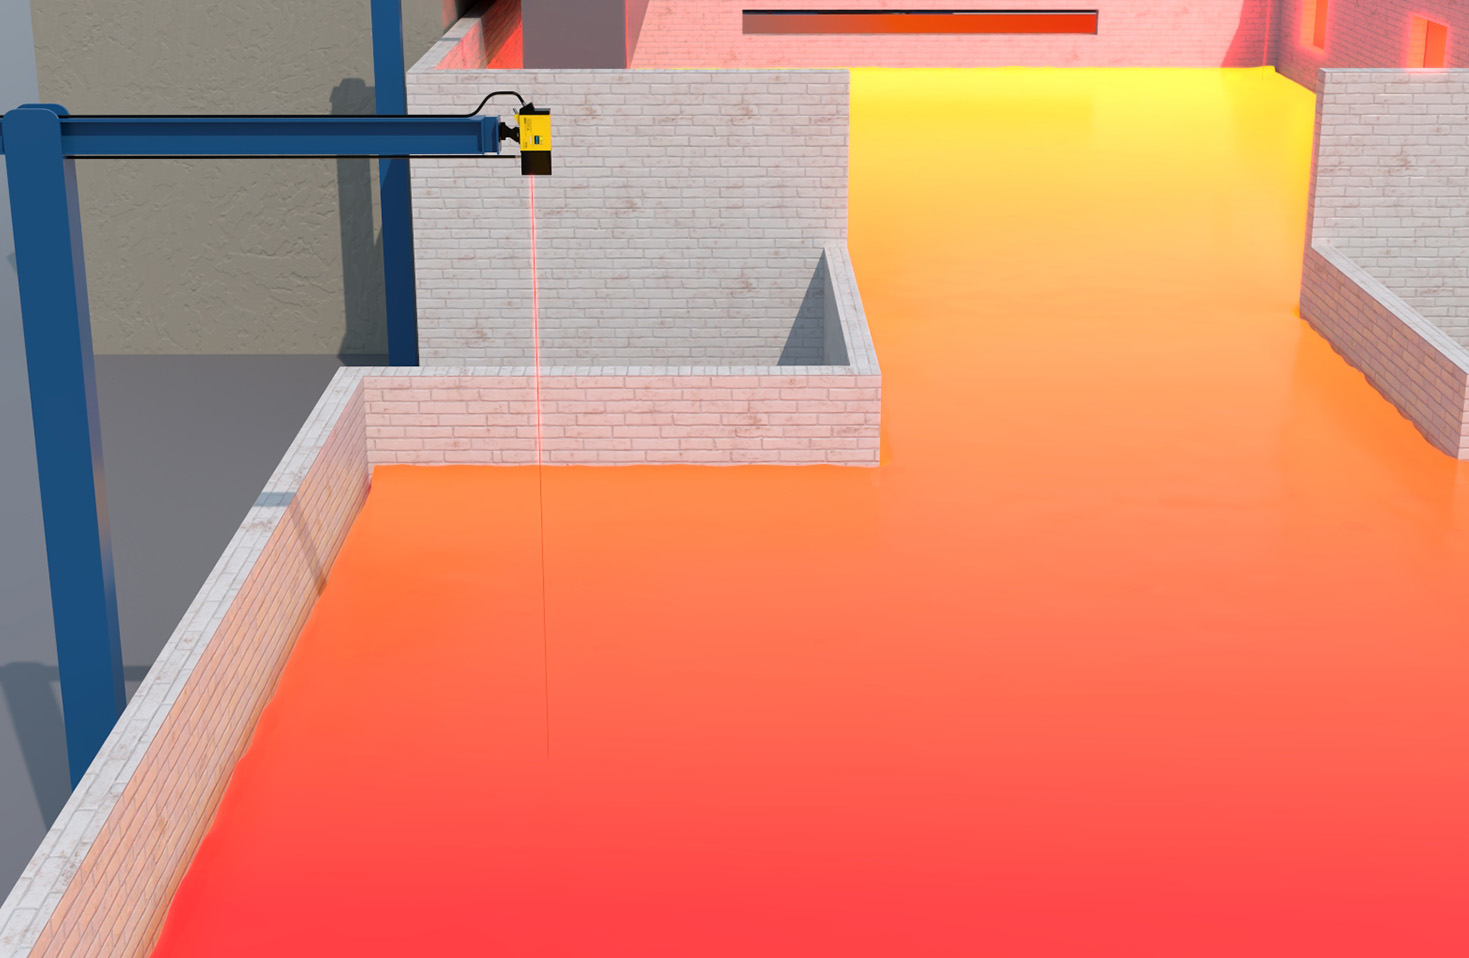
Environmental factors are frequently noted on professional diagrams. These include indicators for allowable ambient light levels, temperature ranges, and potential interference from dust, steam, or vibration. A well-drawn diagram will specify the minimum detectable object size and the sensor's repeatability or resolution, often expressed in micrometers.
Interpreting these diagrams requires an understanding of both the sensor's datasheet specifications and the application's physical layout. For instance, the diagram must align with the mechanical drawing of the installation, ensuring the sensor is mounted at the correct height and orientation to avoid false triggers from background objects or specular reflections from shiny surfaces. Engineers use these diagrams to troubleshoot issues like inconsistent detection, which could stem from the target object being outside the specified sensing window or having a low-reflectivity surface not accounted for in the initial design.
In practice, creating and utilizing an accurate laser sensor position detection diagram is foundational for system integration. It facilitates communication between design engineers, installation technicians, and maintenance personnel. It serves as a reference for calibration, ensuring that the sensor is tuned to the exact background conditions and target properties. As laser sensor technology evolves with features like background suppression, multi-point measurement, and integrated IO-Link communication, the diagrams become more layered, incorporating data flow and configuration parameters alongside the basic optical path.
Ultimately, mastering the laser sensor position detection diagram is essential for leveraging the full potential of these devices. It transforms a powerful sensing principle into a reliable, quantifiable, and maintainable component within a larger automated system, driving efficiency and precision in manufacturing, packaging, assembly, and logistics applications.