Proximity sensors are ubiquitous in modern technology, silently performing critical functions in devices and industrial systems we interact with daily. At their core, these non-contact sensors detect the presence or absence of an object within a specific range without physical touch. Understanding their operation is greatly simplified through a visual breakdown—a proximity sensor diagram. This article demystifies the internal components and working principle of a typical inductive proximity sensor, one of the most common types, using a step-by-step diagrammatic explanation.
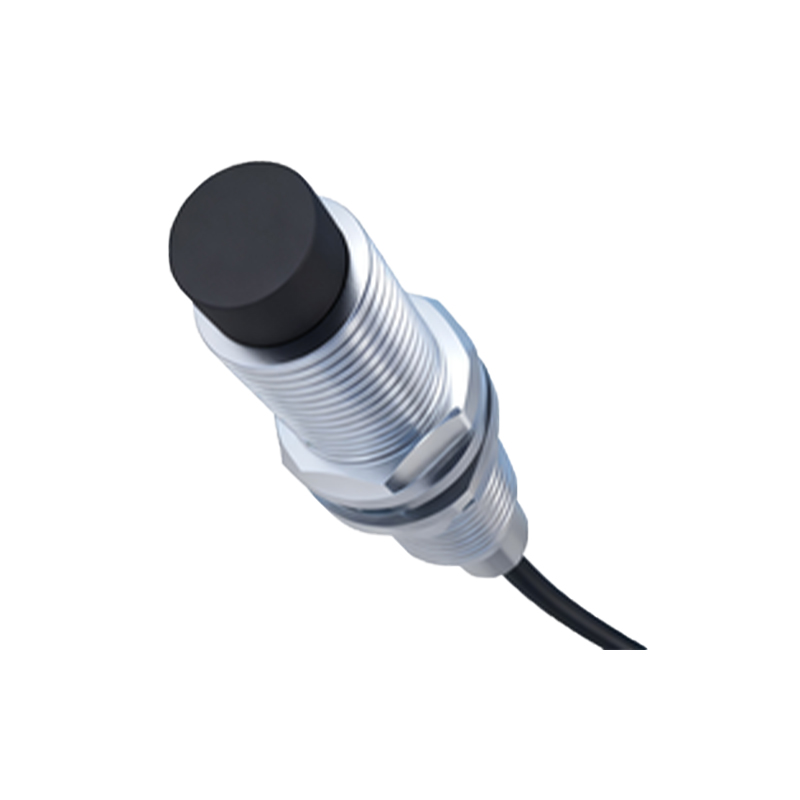
A standard diagram of an inductive proximity sensor reveals several key internal components housed within a robust casing, typically metal or polymer. The front face is the active sensing surface. Directly behind this is the core component: an oscillator coil. This coil generates a high-frequency electromagnetic field that radiates from the sensor's face into its nominal sensing range, depicted in diagrams as a conical or cylindrical field zone. Adjacent to the oscillator is a signal evaluation circuit, often containing a trigger circuit and an amplifier. The final key element shown is the output switching block, which could be an NPN or PNP transistor, a relay, or an analog output stage.
The working principle, as illustrated in a functional diagram, follows a clear sequence. First, when the sensor is powered, the oscillator circuit generates the fluctuating electromagnetic field. In the absence of a target object, this field remains stable, and the evaluation circuit maintains the output device in its default state (e.g., OFF). The diagram shows this as a steady-state condition. The critical change occurs when a metallic target object enters the sensor's field. The diagram typically uses an arrow to indicate this movement. The electromagnetic field induces small circulating currents, called eddy currents, on the surface of the target. These eddy currents draw energy from the oscillator circuit, causing a measurable drop in its oscillation amplitude.
This amplitude reduction is detected by the threshold circuit within the signal evaluation stage. Once the amplitude drop surpasses a preset threshold, the trigger circuit activates. This activation signal is then amplified and sent to the output switching device. The diagram would show a change in state—for instance, an NPN transistor switching ON, allowing current to flow from the load to ground, thereby completing a circuit and signaling the object's detection. A complementary diagram might also show the hysteresis effect, where the target must move slightly farther away to turn the sensor off again, preventing rapid toggling at the detection boundary.
Beyond the inductive type, diagrams help differentiate other major proximity sensor technologies. Capacitive proximity sensor diagrams look similar but highlight a different sensing face design and oscillator setup capable of detecting both metallic and non-metallic materials (plastics, liquids, wood) by measuring changes in capacitance. Ultrasonic sensor diagrams distinctly feature a piezoelectric transducer for emitting sound waves and a receiver, with clear visualizations of the sound wave cone and the time-of-flight measurement principle. Photoelectric sensors, another major category, are shown with an LED light source, a phototransistor receiver, and light path illustrations for through-beam, retro-reflective, and diffuse reflective modes.
The applications of these sensors are vast. In industrial automation, diagrams show them integrated into assembly lines for part counting, position verification, and machine safety interlocks. In consumer electronics, a simplified cross-section diagram might show a miniature infrared proximity sensor near a smartphone's earpiece, deactivating the touchscreen during a call. They are also crucial in automotive systems for parking assistance, in robotics for obstacle detection, and in security systems for occupancy monitoring.
When reading a manufacturer's datasheet diagram, pay close attention to the specified sensing range, which is the maximum reliable detection distance, often shown with different curves for various target materials. The diagram will also indicate the hysteresis zone and the effective sensing field shape. Installation diagrams are crucial, showing the necessary clearance from metal surrounds to avoid false triggering, a concept known as "flush-mountable" or "non-flush" mounting.
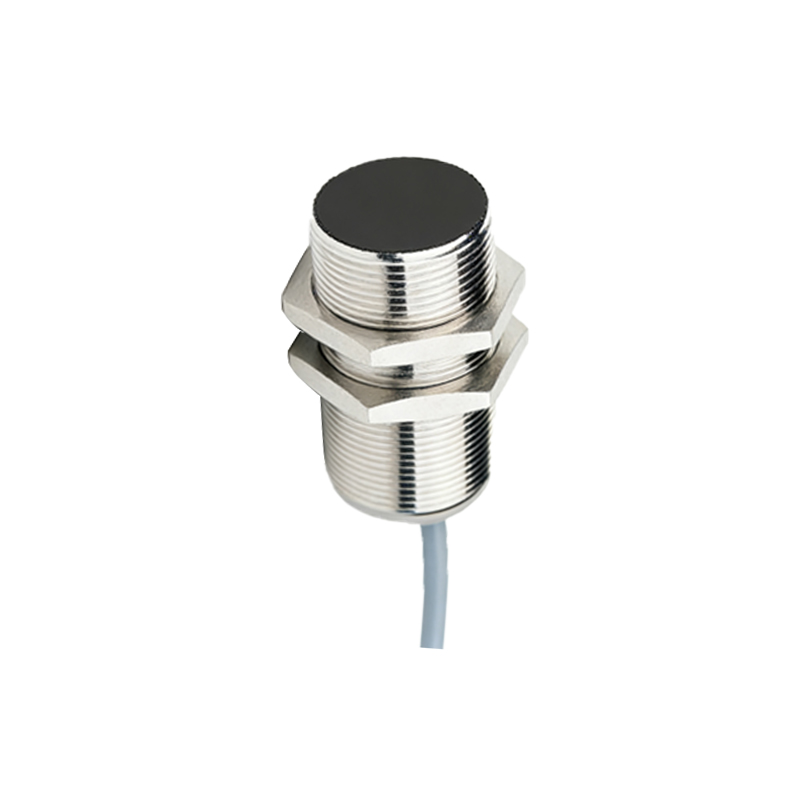
In summary, a proximity sensor diagram serves as an essential roadmap to its functionality. By breaking down the sensor into its core components—oscillator, evaluation circuit, and output stage—and visually tracing the signal path from field generation to switched output, these diagrams transform an abstract concept into a tangible, understandable process. This understanding is fundamental for anyone involved in selecting, installing, or maintaining automated systems across countless industries, ensuring reliable and efficient object detection without physical contact.