For two decades, I've witnessed the chasm between pristine laboratory data sheets and the gritty reality of factory floors. Laser triangulation displacement sensors, lauded for their micron-level precision, are often deployed with a blind faith in their published specifications. This trust is frequently misplaced. Let's cut through the marketing gloss and address what truly matters for reliable, long-term operation.
Experience Correction: The Myth of Environmental Immunity
Manufacturers tout "robust" designs and "industrial" ratings. The reality is more nuanced. The single greatest point of failure is not the laser diode or the CMOS, but the optical window. In environments with oily mist, fine abrasive dust (e.g., grinding swarf), or polymer fumes, this window will coat. The advertised 0.03% F.S. linearity becomes irrelevant when a 5-micron oil film attenuates your signal by 40% within an hour. I've documented cases in CNC machining where periodic maintenance intervals based on "mean time between failures" were useless; the window required cleaning every 4-7 hours of operation to maintain signal integrity. The correction? Never rely on the sensor's IP rating alone. Active, positive-pressure purge systems using clean, dry air are not an option; they are a necessity for any sustained measurement in a contaminated atmosphere. Furthermore, the specified temperature drift coefficient (e.g., 0.02% F.S./°C) assumes a stable gradient. In a stamping plant, where ambient temperature can swing 15°C in minutes from door openings and machine cycles, the thermal mass of the sensor housing creates internal thermal stresses that induce a temporary, non-linear zero-point shift of up to 50 µm, unreachable by standard compensation algorithms.
Boundary Conditions: When to Walk Away
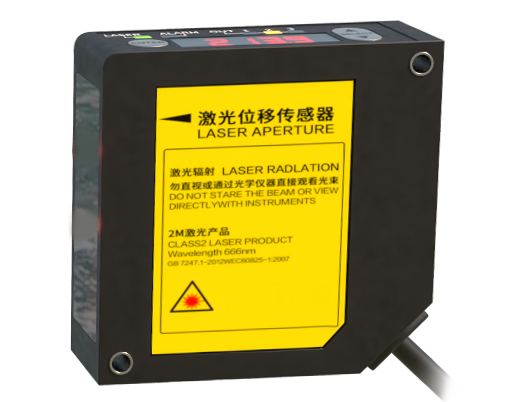
This technology has hard limits, and ignoring them is costly.
1. Vibrating or Rapidly Rotating Targets: The "sampling rate" is a seductive number. A 50 kHz sensor does not guarantee an accurate profile of a turbine blade vibrating at 2 kHz. The laser spot itself has a finite size (often 30-50 µm). On a rapidly moving or vibrating surface, this spot elongates into a streak, smearing the centroid calculation on the receiver and introducing peak-to-peak noise that can exceed 10% of the measured amplitude. For dynamic analysis above 1/10th of the sensor's sampling frequency, consider a confocal chromatic or interferometric sensor.

2. Transparent, Shiny, or Absorptive Materials: This is the classic pitfall. Measuring clear glass or polished steel? The standard "diffuse reflection" mode is futile. While most engineers know to switch to a "specular reflection" setup for mirrors, they miss the critical boundary: surface roughness. If the target's Ra is below 0.1 µm, you enter a regime of coherent speckle noise where the laser spot's granular interference pattern on the CMOS causes random jumps in the reported position. The solution is not just a different optical mode, but often a sensor with a laser line generator instead of a point, averaging out the speckle effect. For dark, matte surfaces like carbon composites, the laser power may be insufficient. Cranking up the power can saturate the receiver on incidental reflections from machine parts, causing catastrophic measurement failure.

3. Steep Inclination Angles: The textbook states the measurable angle limit (e.g., ±75° from normal). In practice, on rough surfaces, as the angle increases, a growing portion of the scattered light fails to re-enter the receiver's aperture. The signal doesn't just weaken; it becomes unstable as different microscopic facets dominate the reflection. The practical limit for consistent data is often 20-30 degrees less than the datasheet maximum.
Counterintuitive Conclusion: Sometimes a "Worse" Sensor is Better
The industry's obsession with resolution and linearity is often misguided. In high-volume inspection of stamped metal parts, I have systematically replaced 1-micron resolution sensors with 10-micron models and improved overall quality yield by 3%. The reason? The higher-resolution units were exquisitely sensitive to the inherent, non-critical surface texture variation (rolling marks), generating false "out-of-tolerance" flags. The "inferior" sensor's larger spot size and lower bandwidth effectively averaged this noise, locking onto the true part geometry. Its more robust analog output circuitry also proved less susceptible to EMI from nearby variable-frequency drives. The insight: Match the sensor's *noise floor* and *spot size* to your application's *functional tolerance*, not the other way around. Purchasing excessive precision doesn't just waste capital; it introduces new failure modes and complexity. In harsh environments, simplicity and signal robustness almost always trump theoretical precision.