Proximity sensors are essential components in modern electronics, robotics, and automation systems. Drawing these devices accurately is crucial for engineers, designers, and students to communicate ideas effectively in schematics, technical documentation, or educational materials. This guide provides step-by-step techniques and industry-standard practices for creating clear and precise proximity sensor illustrations.
Understanding the basic types of proximity sensors is the first step toward accurate drawing. Inductive sensors detect metallic objects using electromagnetic fields, while capacitive sensors respond to both metallic and non-metallic materials. Photoelectric sensors use light beams, and ultrasonic sensors rely on sound waves. Each type has distinct visual characteristics that should be reflected in drawings. For example, inductive sensors often feature coil symbols, while photoelectric sensors include light emitter and receiver icons.
Begin with simple geometric shapes to construct the sensor body. Most proximity sensors have cylindrical or rectangular housings. Use clean lines and consistent proportions—typical industrial sensors follow specific size ratios. For cylindrical sensors, start with a rectangle to represent the side view, then add semicircles for the ends. The sensing face should be clearly marked, usually with a textured pattern or directional lines indicating the detection area.
Internal components require careful representation. While detailed cross-sections are complex, simplified diagrams should show key elements: the oscillator coil in inductive sensors, LED and phototransistor in photoelectric types, or transducer plates in capacitive models. Use standard electrical symbols for these components, maintaining alignment with international standards like IEC or ANSI. Shading and gradient techniques can help distinguish between housing, circuitry, and sensing elements.
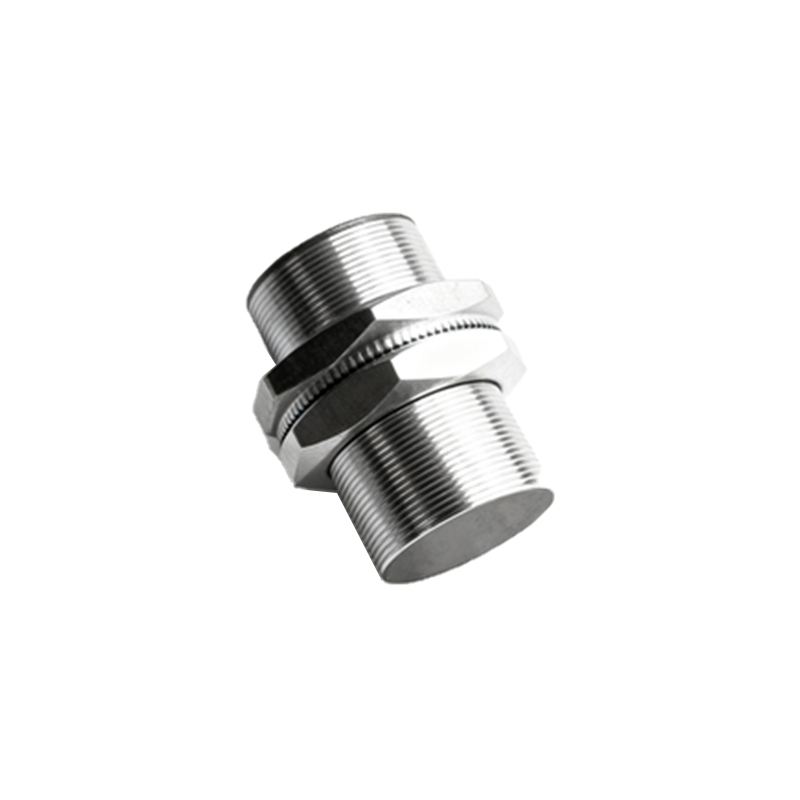
Wiring and connections are critical aspects. Most proximity sensors have three to four wires: power supply, ground, output signal, and sometimes a separate control line. Draw these as straight lines with clear labels (e.g., +V, 0V, OUT). For threaded barrel-style sensors, include detailed threads using helical lines or simplified representations. Mounting brackets, nuts, or flanges should be drawn with attention to mechanical accuracy, as they affect installation diagrams.
In schematic diagrams, proximity sensors are represented by specific symbols. The IEC symbol for an inductive proximity sensor is a square with a diamond shape inside, while photoelectric sensors combine a diode symbol with a receiver icon. Always place these symbols near the components they interact with, using dashed lines to indicate detection ranges. Include annotations for sensing distance, voltage ratings, and output types (PNP/NPN).
Color and texture choices enhance clarity. Industrial drawings often use grayscale with high contrast, but colored diagrams can differentiate wire types or detection zones. Blue commonly indicates sensing fields, red for power lines, and black for outputs. Avoid overly vibrant colors that may distract from technical details. Hatching patterns can represent materials—aluminum housings might use a light dot pattern, while plastic parts remain untextured.
Perspective and scaling require attention. Isometric or orthographic projections are preferred over perspective views for technical accuracy. Maintain consistent scaling: if the sensor diameter is 18mm in reality, the drawing should proportionally reflect this. Include dimension lines with measurements for critical features like sensing range, thread size, or mounting holes. Use arrowheads and text boxes for annotations, ensuring they don’t overlap key components.
Software tools can streamline the process. Applications like AutoCAD Electrical, EPLAN, or even vector-based tools like Inkscape offer libraries of sensor symbols. However, hand-drawn sketches remain valuable for quick conceptual work. Start with pencil drafts to layout proportions, then ink the final lines. Digital tools allow easy adjustments, layering, and export to common formats like PDF or SVG for documentation.
Common mistakes to avoid include omitting polarity markings, misrepresenting sensing directions, or using inconsistent line weights. Always double-check symbol orientation—the sensing face should point toward the target area. Ensure output logic (normally open/closed) is indicated if relevant. For ultrasonic sensors, draw the conical detection zone with fading edges to represent sound wave dispersion.
Practice exercises improve proficiency. Try drawing a standard M18 inductive sensor from three views: front, side, and top. Next, illustrate a rectangular photoelectric sensor with alignment indicators. Finally, create a system diagram showing multiple sensors connected to a PLC, with wiring paths and I/O points labeled. Reference manufacturer datasheets for real-world examples, noting how they balance detail and simplicity.
Advanced techniques involve dynamic representations. For animated technical manuals, show the sensor’s detection field activating when a target enters the zone. Use sequence diagrams to illustrate timing cycles, like response delays or output pulses. In educational materials, exploded views can separate housing, circuit board, and lens assemblies to explain internal workings.
Ultimately, effective proximity sensor drawings balance accuracy with clarity. They should communicate function instantly to engineers, technicians, or procurement specialists. Whether for prototyping, maintenance guides, or academic