Introduction to Handheld Radar Photoelectric Sensors
Handheld radar photoelectric sensors represent a significant advancement in non-contact measurement and detection technology. These portable devices combine the principles of radar and photoelectric sensing to provide highly accurate data in various industrial and field applications. Unlike stationary systems, their handheld nature offers unparalleled flexibility, allowing engineers and technicians to perform inspections, measurements, and diagnostics in hard-to-reach or dynamic environments. The core functionality hinges on emitting either radio waves or light beams and analyzing the reflected signals to determine parameters such as distance, presence, speed, and even material composition. This dual-technology approach mitigates the limitations of using either technology alone, ensuring reliable performance across diverse conditions including varying light levels, dust, smoke, or adverse weather.
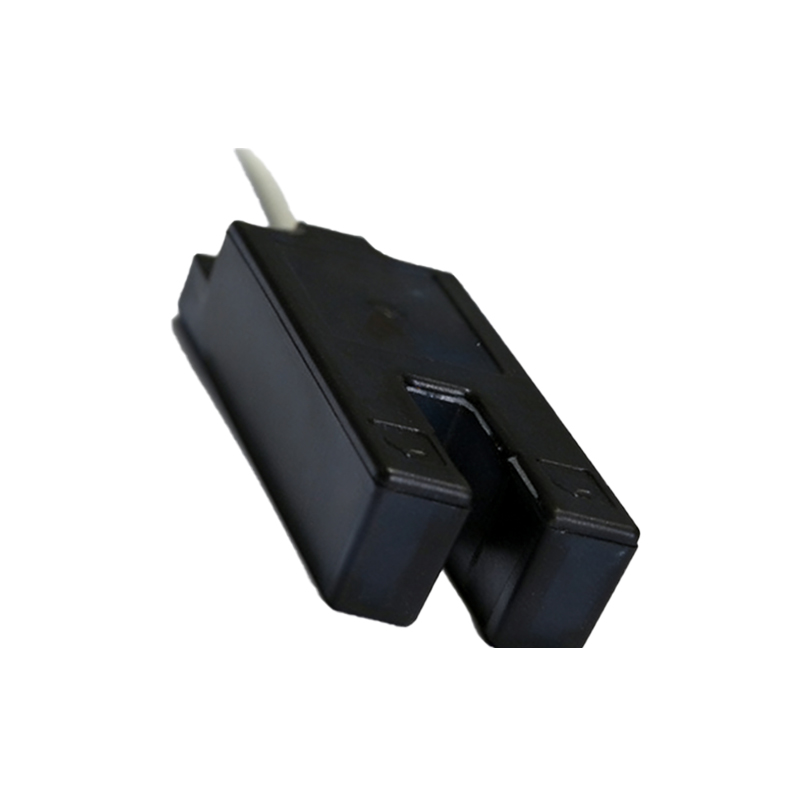
Interpreting Key Image Components and Diagrams
Technical images and diagrams of these sensors are crucial for understanding their design and operation. A standard cutaway or exploded-view diagram typically reveals several key components. The housing, often made of ruggedized polymer or aluminum, is designed for ergonomic grip and environmental protection (IP ratings are a common specification highlighted). The front face will show the emission and reception windows for both the radar antenna and the photoelectric lens. Internal diagrams detail the core modules: the RF circuit board for radar generation and processing, the laser diode or LED source with its driver, the photodetector (like a photodiode or CCD), and the central processing unit that fuses data from both streams. Wiring schematics accompanying these images illustrate connections for power (often DC or rechargeable battery packs), output signals (digital IO, analog voltage/current, or serial communication like RS-485), and sometimes configuration interfaces (USB or Bluetooth). Labels on these images point to calibration points, status LEDs, and control buttons.
Analysis of Performance Graphs and Output Waveforms
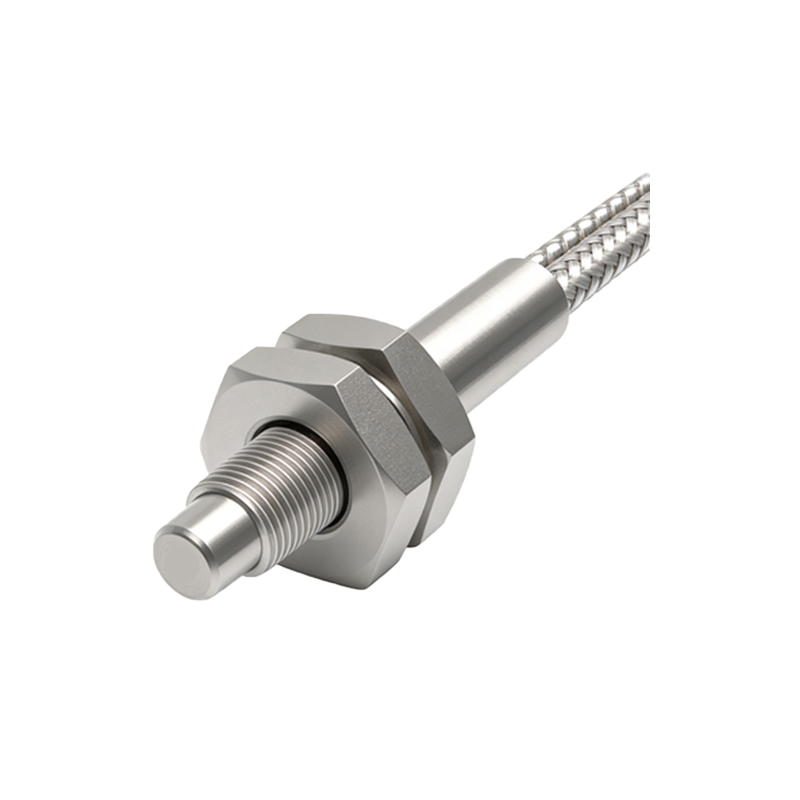
Images depicting performance graphs are essential for evaluation. A common graph plots detection range versus object reflectivity for both radar and photoelectric modes, often showing two distinct curves. The radar curve may demonstrate longer range and less sensitivity to surface color or material, while the photoelectric curve shows higher precision at shorter ranges but potentially more variance with surface properties. Another critical image is the output signal waveform diagram. This shows how the sensor's output (e.g., a switching signal or analog level) responds to an object entering its field. Clean, sharp transitions indicate high response speed and minimal hysteresis. Timing diagrams are also prevalent, illustrating the relationship between the emitted pulse, the received echo, and the processed output delay, which is vital for high-speed or synchronized applications.
Application-Specific Imaging and Field Use Cases
Real-world application photos provide context for deployment. One image might show a technician using the sensor to measure the fill level of a bulk solid in a silo from a manhole, with an inset diagram showing the signal path. Another could depict alignment checks on conveyor belts, where a laser dot from the photoelectric component provides visual guidance while radar ensures continuous tracking despite dust. Thermal imaging overlays are sometimes used in diagnostic pictures to show heat dissipation of the sensor during continuous operation, informing thermal management decisions. Field setup images often highlight accessories: mounting brackets, alignment tools, sighting scopes for the laser, and protective caps. These photos emphasize practical aspects like how to hold the device for stable readings and how to interpret the real-time data displayed on an integrated screen or transmitted to a connected tablet.
Troubleshooting Based on Visual Indicators and Error Codes
A section of the manual or technical sheet is dedicated to troubleshooting images. These include pictures of the device's display panel or LED indicator patterns (e.g., steady green, blinking red) with corresponding fault descriptions, such as "low battery," "signal saturation," or "alignment error." Flowchart diagrams guide the user through a visual diagnostic process: start with an image of the powered-on sensor, then branch based on what the status LED shows, leading to checkpoints like "inspect lens for dirt" (shown with a photo of a contaminated lens) or "verify target is in detection range" (shown with a distance reference image). Comparative images of correct versus incorrect installation angles or mounting distances are extremely valuable for field correction without requiring complex instruments.
Future Trends and Imaging in Sensor Development
Finally, conceptual images and renderings illustrate future trends. These may show increasingly miniaturized designs with integrated augmented reality (AR) displays projected onto the sensor housing itself, providing real-time data visualization. Block diagrams depict next-generation architectures where sensor fusion algorithms are more deeply embedded, showing cloud connectivity icons for data logging and analysis. Exploded views of modular designs highlight user-replaceable components like different antenna heads or lens types for specific frequency bands or optical filters. These forward-looking images help engineers plan for upcoming technology integrations, such as the combination of LiDAR-like precision with radar's penetration capabilities, all packaged in a handheld form factor. Understanding these visual guides is paramount for selecting, applying, and maintaining these sophisticated tools effectively in modern electrical and automation projects.