Introduction to Photoelectric Sensor Diagrams
Creating a clear and accurate basic structure diagram of a photoelectric sensor is essential for engineers, technicians, and students in the electrical and automation industries. Such diagrams serve as fundamental tools for understanding operational principles, facilitating design discussions, and aiding in troubleshooting. A well-drawn diagram visually breaks down the core components and their interrelationships, translating complex electo-optical interactions into an accessible format. This guide provides a step-by-step approach to drafting this diagram, focusing on standard symbols, logical layout, and adherence to common industry practices. Mastery of this skill enhances technical documentation and communication within projects involving object detection, positioning, and automation control systems.
Gathering Essential Components and Symbols
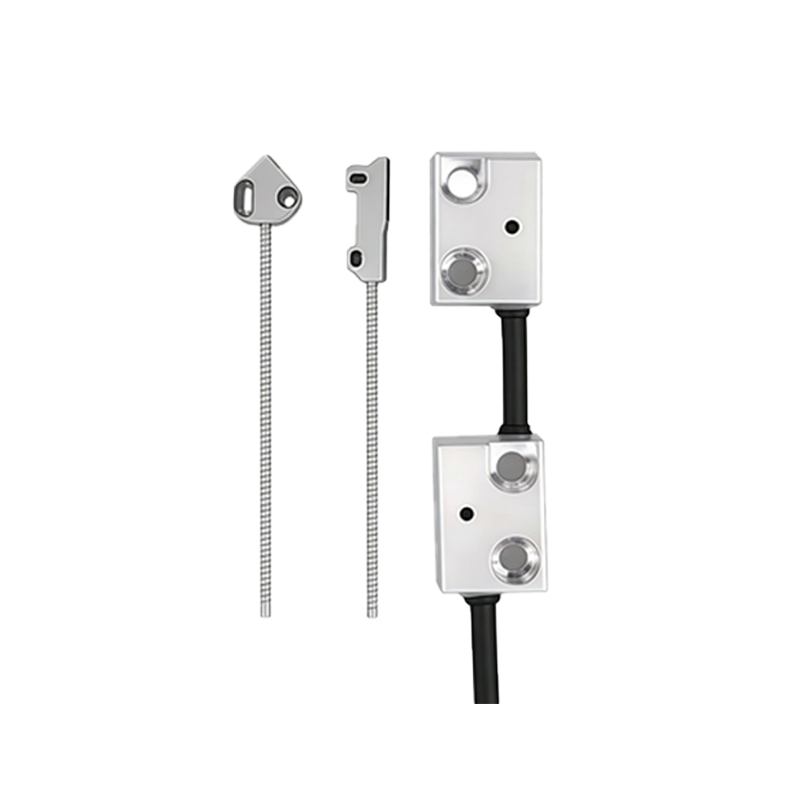
Before starting the drawing, familiarize yourself with the key components of a typical photoelectric sensor. The primary elements include the light emitter (usually an LED or laser diode), the light receiver (such as a phototransistor or photodiode), the housing or casing, the optical path, and the electrical connection terminals. For the diagram, you will need to use or create standard graphical symbols. While there isn't a single universal standard, common conventions represent the emitter as a circle with an outward-pointing arrow and the receiver as a circle with an inward-pointing arrow. The housing is often shown as a rectangle enclosing the optical components. Have these symbol templates ready, either in digital CAD software libraries or as hand-drawing stencils, to ensure consistency and clarity.
Choosing the Right Tools and Medium
The choice of drawing tool depends on the required precision and final use case. For formal engineering documents, computer-aided design (CAD) software like AutoCAD Electrical, EPLAN, or even general-purpose tools like Microsoft Visio or draw.io are recommended. These programs offer libraries of electrical and electronic symbols, precise alignment tools, and easy editing. For quick sketches or brainstorming, a pencil, ruler, and graph paper suffice. Digital tools are preferable as they allow for neat labeling, layer management, and easy sharing. Ensure your selected medium supports clear line work and text annotation, as details are crucial for technical accuracy.
Drafting the Core Structural Layout
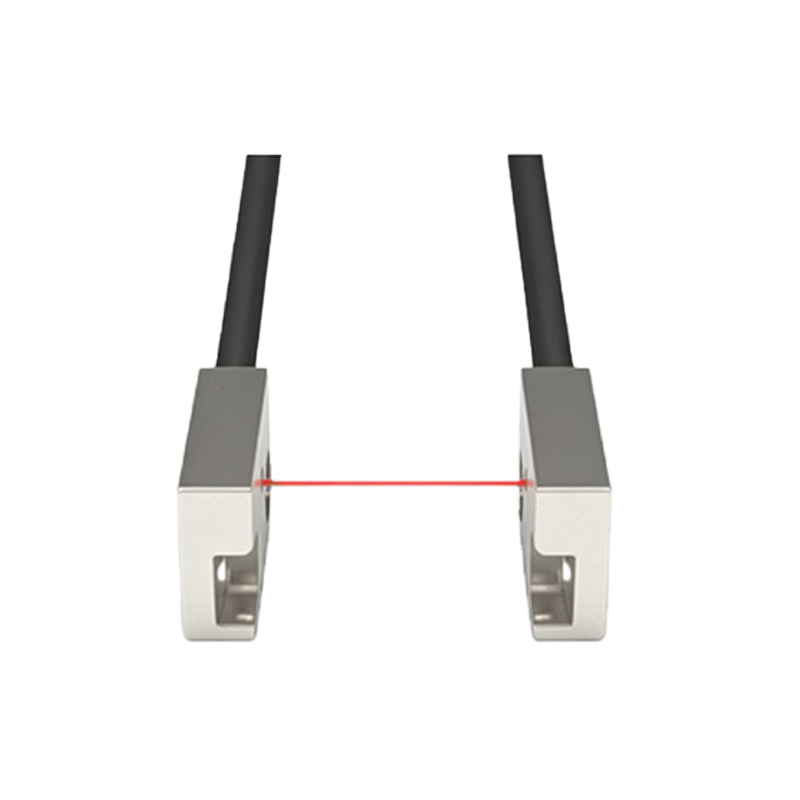
Begin by establishing the main framework. Draw a central rectangle to represent the sensor's main body or housing. Within this rectangle, position two smaller, distinct symbols on opposite ends: the light emitter on one side and the light receiver on the other. Between them, illustrate the optical path with a dashed or solid straight line, indicating the beam's trajectory. If depicting a reflective or retro-reflective sensor type, show the path deflecting to an external target or reflector. Space the components evenly to avoid clutter. This layout forms the backbone of the diagram, clearly separating the transmitting and receiving functions within the unified housing structure.
Adding Detailed Internal Circuitry
A basic structural diagram should hint at the internal electronics driving the sensor. Adjacent to the emitter symbol, add a simple circuit representing the driving oscillator or constant current source, often shown with a waveform symbol or a transistor circuit. Near the receiver, sketch the amplification and signal conditioning circuit, which may include an operational amplifier symbol and a Schmitt trigger icon to denote the switching output. Connect these sub-circuits to the respective optical components with fine lines. Use standard symbols for resistors, capacitors, and transistors. This step adds functional depth, showing how electrical signals are converted to light and back again.
Incorporating External Connections and Output
Photoelectric sensors interface with larger control systems. Extend lines from the sensor housing to represent the electrical terminals. Typically, these include power supply connections (Vcc and GND) and the output line (often an NPN or PNP transistor output). Label these terminals clearly (e.g., +V, 0V, OUT). You may also add a small icon for a load, like a relay coil or PLC input, connected to the output terminal. This illustrates the sensor's role in a complete circuit, making the diagram practically useful for wiring and integration purposes.
Applying Labels, Annotations, and Legends
Clarity is paramount. Label every major component directly or with leader lines: "Light Emitter (LED)", "Phototransistor Receiver", "Housing", "Optical Beam". Annotate key parameters if relevant, such as "Modulated Light" or "Sensing Range". Include a brief legend if using any non-standard symbols. Title the diagram clearly at the top, for example, "Basic Through-Beam Photoelectric Sensor Structure". Use a consistent font size, ensuring all text is legible. Proper labeling transforms the drawing from a simple sketch into an informative technical reference.
Reviewing for Accuracy and Clarity
Once the draft is complete, review it meticulously. Verify that all symbols are correctly used and placed. Check the logical flow: does the diagram accurately represent the signal path from power input to light emission, reception, and final output? Ensure there are no ambiguous lines or overcrowded areas. Seek feedback from a colleague if possible; a fresh perspective can catch oversights. A good diagram should be self-explanatory to a trained professional in the field, effectively conveying the sensor's architecture without requiring extensive verbal explanation.
Finalizing and Exporting the Diagram
After revisions, finalize the drawing. In digital tools, clean up line weights—use thicker lines for the housing and main components, thinner lines for internal connections. Apply a consistent color scheme if desired (e.g., blue for light beam, black for electronics). Save the file in appropriate formats: vector formats like SVG or PDF for scalability, and high-resolution PNG for digital documents. For hand-drawn diagrams, ink over the pencil lines and erase any guidelines. The finalized diagram is now ready for inclusion in datasheets, training manuals, or project proposals, serving as a precise visual aid.