Understanding Proximity Sensor Basics
Proximity sensors are non-contact devices that detect the presence or absence of objects within a specified range. They operate based on various principles, including inductive, capacitive, ultrasonic, and photoelectric technologies. Inductive sensors are ideal for detecting metallic objects, while capacitive sensors can handle both metallic and non-metallic materials. Ultrasonic sensors use sound waves for distance measurement, and photoelectric sensors rely on light beams. Each type has unique applications, and selecting the right one depends on factors like material composition, environmental conditions, and required sensing distance. Diagrams play a crucial role in illustrating these differences, helping engineers visualize operational mechanisms and integration methods. For instance, a typical diagram might show the sensor's field of view, detection zones, and output signal behavior, providing a clear foundation for practical implementation.
Interpreting Wiring Diagrams for Installation
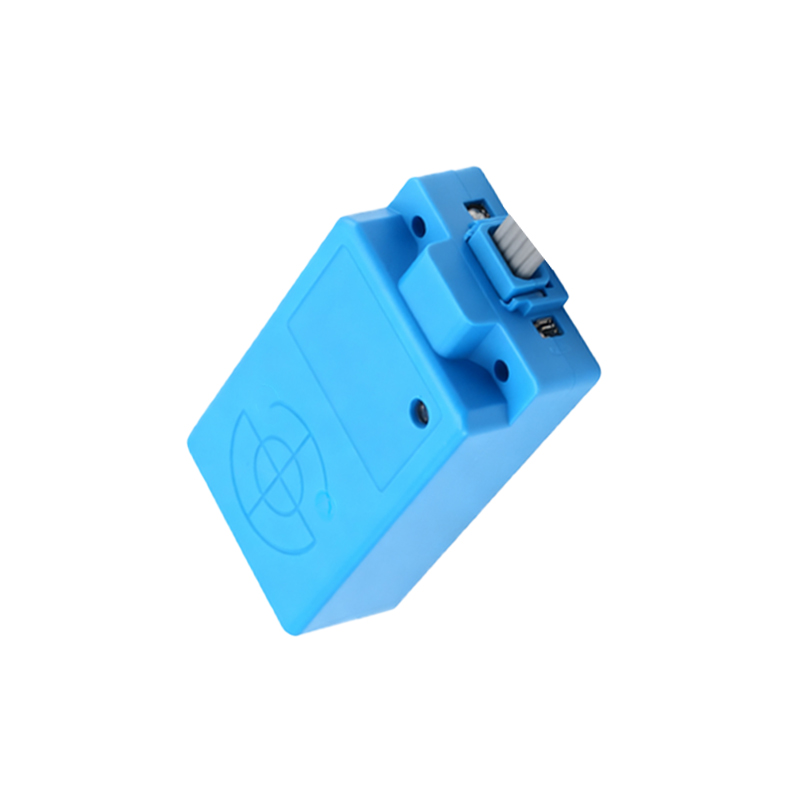
Wiring diagrams are essential for correctly connecting proximity sensors to control systems, such as PLCs (Programmable Logic Controllers) or relays. A standard diagram includes symbols for power supply, load, and sensor terminals, often labeled as V+ (positive), V- (negative or ground), and OUT (output). For example, in a 3-wire DC inductive sensor, the diagram illustrates how to connect the brown wire to positive voltage, blue to negative, and black to the load. Diagrams also indicate protective measures like shielding or grounding to prevent electrical noise interference. By following these visual guides, engineers can ensure proper polarity, avoid short circuits, and optimize sensor performance. Additionally, diagrams may highlight diagnostic features, such as LED indicators for power and detection status, simplifying troubleshooting during setup.
Analyzing Detection Range and Field Patterns
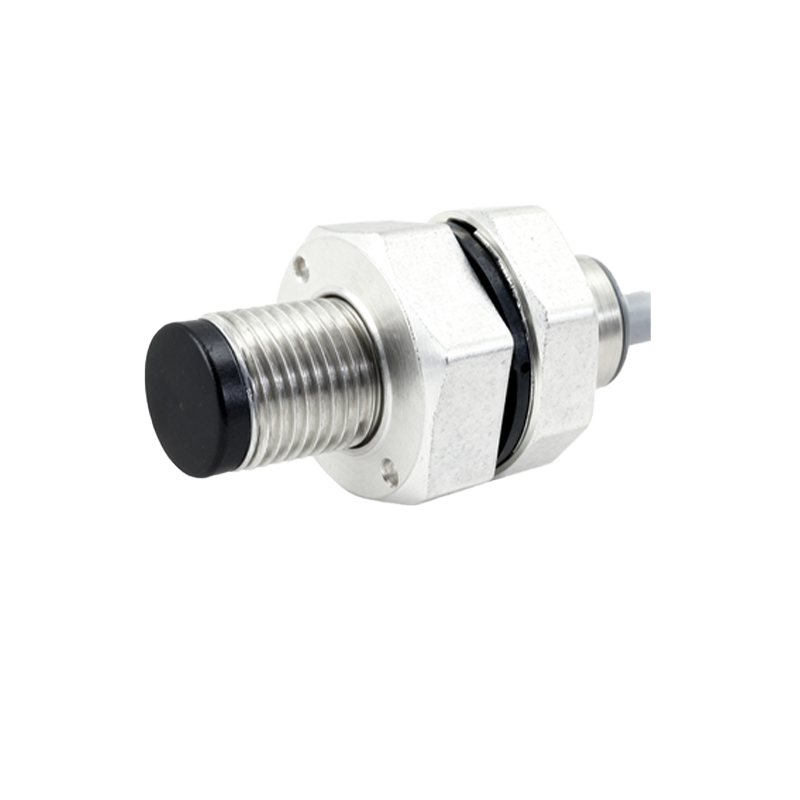
Diagrams that depict detection ranges and field patterns help engineers position sensors accurately in industrial setups. A common diagram shows the sensor's sensing distance, often labeled as Sn, which varies by model and object material. For inductive sensors, diagrams might include correction factors for different metals, like steel versus aluminum. Field patterns, such as cylindrical or rectangular shapes, are illustrated to demonstrate the effective detection area. Understanding these diagrams prevents misalignment issues, such as false triggers or missed detections. For instance, a diagram could illustrate how to mount a sensor parallel to a conveyor belt to detect passing objects without physical contact, ensuring reliable operation in high-speed automation lines.
Integrating Sensors with Control Systems via Diagrams
Integration diagrams show how proximity sensors interface with broader control systems, including timing sequences, logic circuits, and feedback loops. These diagrams often use ladder logic or block diagrams to represent sensor inputs triggering outputs, like activating a motor or solenoid valve. For example, a diagram might illustrate a sensor detecting a part on an assembly line, sending a signal to a PLC, which then commands a robotic arm to pick up the part. Such visuals clarify signal flow, timing delays, and synchronization with other devices. Engineers use these diagrams to program logic, set parameters like hysteresis or response time, and ensure seamless communication between sensors and controllers, enhancing system efficiency and safety.
Troubleshooting Common Issues Using Diagnostic Diagrams
Diagnostic diagrams aid in identifying and resolving sensor malfunctions, such as intermittent detection or output failures. These diagrams typically include flowcharts or schematic views of error scenarios, like electrical overloads, environmental interference, or mechanical misalignment. For instance, a flowchart might guide engineers through steps: check power supply, inspect wiring connections, verify object material compatibility, and test sensor output with a multimeter. Diagrams also highlight warning signs, like reduced sensing range due to contamination or temperature extremes. By referencing these visuals, engineers can perform systematic checks, reduce downtime, and maintain sensor reliability in harsh industrial environments, ensuring continuous operation.
Applying Diagrams in Real-World Industrial Scenarios
Real-world application diagrams demonstrate how proximity sensors are used in specific industries, such as automotive manufacturing, packaging, or material handling. These diagrams often include layout plans, showing sensor placements on machinery like CNC machines, robotic cells, or conveyor systems. For example, a diagram might illustrate multiple sensors monitoring positions of components in a welding station, with annotations for safety zones and redundancy measures. Such visuals help engineers design efficient layouts, optimize space, and comply with safety standards like ISO 13849. By studying these diagrams, professionals can adapt best practices to their projects, improving accuracy and productivity in automated processes.