Introduction to Photometric Parameters
Photometric displays in photoelectric sensors are critical for evaluating performance in industrial automation. These parameters quantify the amount of visible light perceived by the sensor, directly influencing detection reliability. Key metrics include luminous intensity, measured in candelas (cd), and illuminance, expressed in lux (lx). Engineers rely on these values to calibrate sensors for specific ambient conditions, ensuring consistent operation. The photometric data helps in selecting the appropriate sensor type—diffuse, retro-reflective, or through-beam—for applications ranging from object detection to precise positioning. Understanding these fundamentals is essential for optimizing sensor integration and minimizing false triggers in dynamic environments.
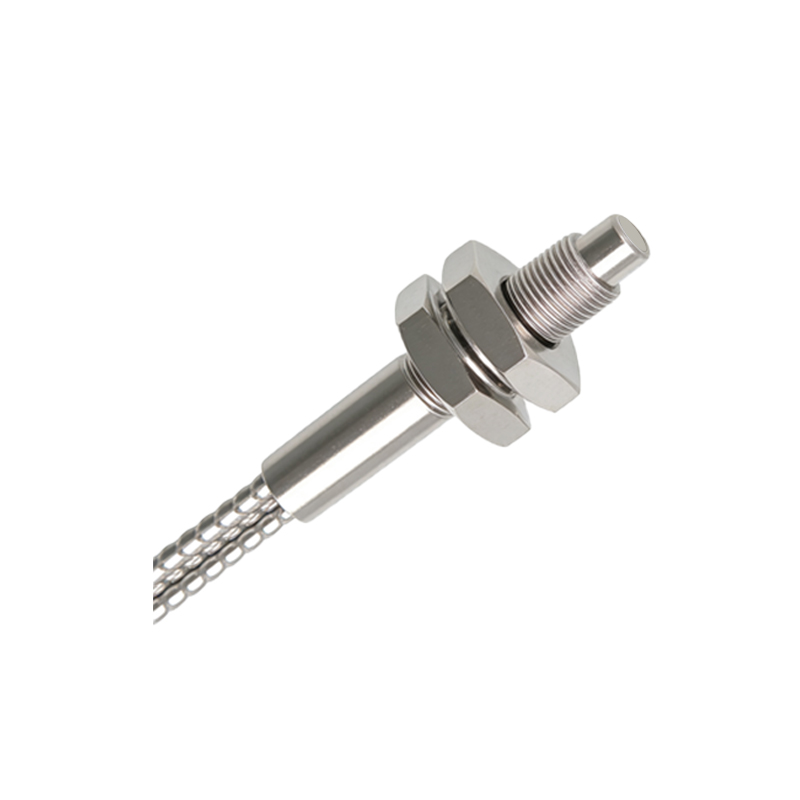
Principles of Light Measurement
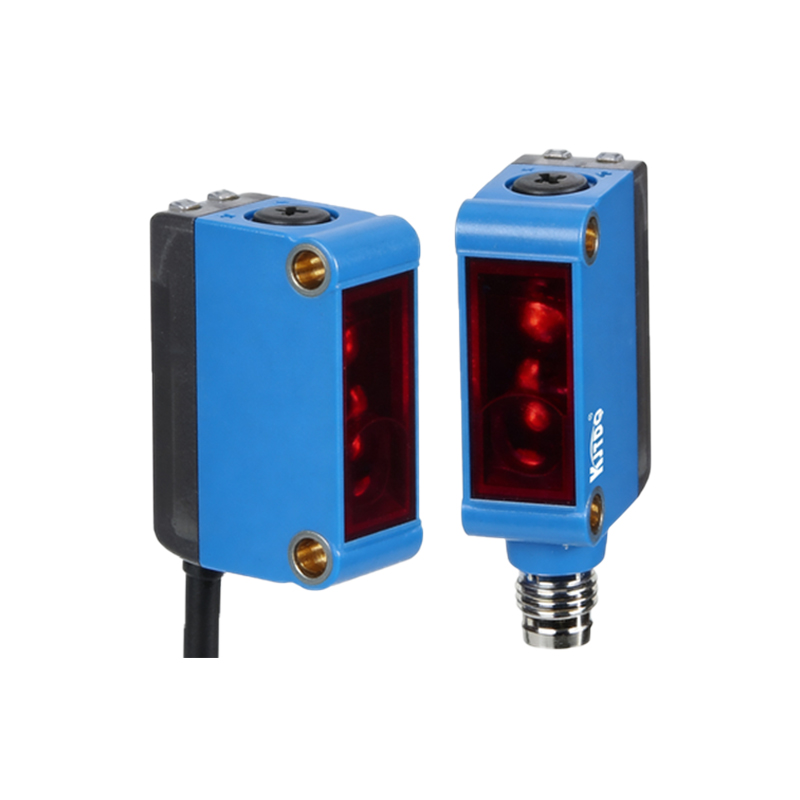
The core principle involves converting light energy into electrical signals via photodiodes or phototransistors. Photometric displays account for the human eye's sensitivity curve, known as the photopic response, which peaks at 555 nm (green light). Sensors are calibrated to this curve to reflect perceived brightness accurately. In contrast, radiometric measurements consider total light energy without human bias. For photoelectric sensors, this distinction ensures displays align with practical visibility in factories or warehouses. Advanced sensors incorporate filters to mimic this response, providing readings that correlate with operational visibility under varying light sources like LEDs or incandescent bulbs.
Interpreting Display Readings
Modern photoelectric sensors feature digital or analog displays showing real-time photometric values. A typical display might indicate lux levels, with thresholds set for high/low alarms. For instance, a reading of 500 lx could signify optimal detection in a well-lit area, while a drop below 100 lx might trigger a maintenance alert. Engineers must interpret these in context—ambient light interference, sensor aging, or lens contamination can skew readings. Regular calibration against standard light sources ensures accuracy. Displays often include trend graphs, helping identify gradual changes that could impact long-term performance, such as dust accumulation on emitter lenses.
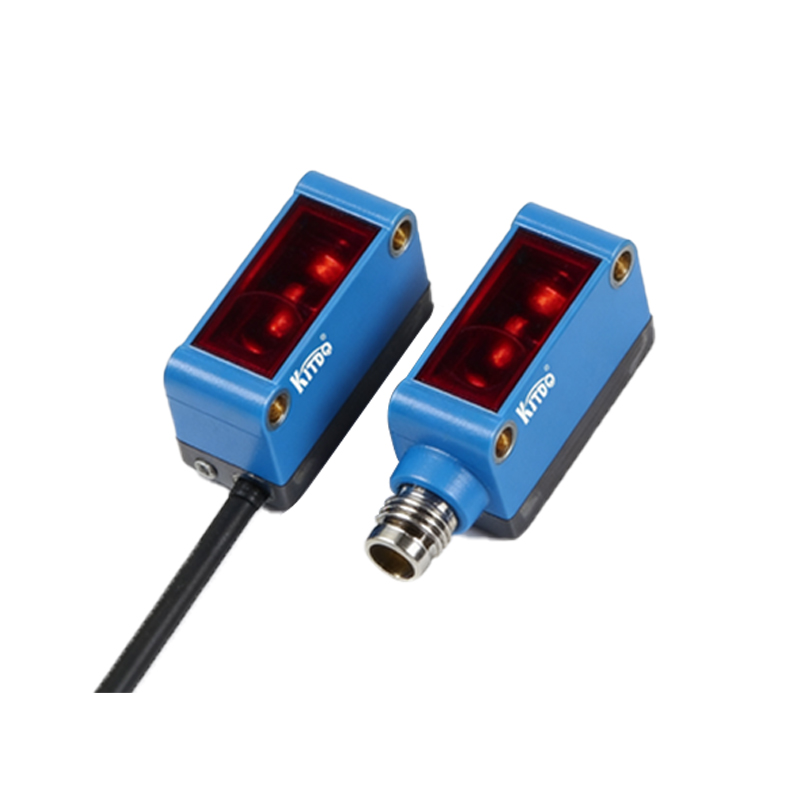
Calibration and Maintenance Protocols
Calibrating photometric displays involves using reference light sources with known luminous flux. Procedures follow ISO/IEC standards to maintain traceability. Sensors should be calibrated annually or after environmental exposure—like high humidity or temperature swings—that can alter photodiode sensitivity. Maintenance includes cleaning optical components with lint-free cloths and verifying alignment. Displays may show error codes (e.g., "ERR-02" for signal drift), prompting recalibration. Documenting calibration history ensures compliance with industry regulations and prolongs sensor lifespan, reducing downtime in automated systems.
Applications in Industrial Settings
Photometric displays enhance reliability in diverse applications. In packaging lines, sensors monitor label detection by assessing reflected light intensity, with displays alerting operators to misalignments. Automotive assembly uses them for part presence verification, where consistent lux readings prevent jams. In low-light environments, like pharmaceutical cleanrooms, displays help adjust emitter power to avoid oversaturation. Data from displays can integrate with PLCs (Programmable Logic Controllers) for automated adjustments, enabling predictive maintenance. Case studies show that optimizing photometric settings can improve detection rates by up to 30% in high-speed sorting systems.
Future Trends and Innovations
Emerging technologies are reshaping photometric displays. Smart sensors with IoT connectivity transmit real-time data to cloud platforms, allowing remote monitoring via dashboards. AI algorithms analyze photometric trends to predict failures before they occur. Enhanced displays now offer color-coded indicators (e.g., green for optimal, red for fault) for quicker diagnostics. Research into multispectral sensors aims to expand beyond visible light into UV and IR ranges, providing broader environmental insights. These advancements will further embed photometric data into Industry 4.0 frameworks, driving efficiency in next-generation automation.