Introduction to Photoelectric Sensor Faults
Photoelectric sensors are widely used in industrial automation for detecting objects, counting, and positioning. However, like any electronic device, they are prone to faults that can disrupt operations. Understanding common failure modes through diagrams can significantly aid in troubleshooting and maintenance. This guide provides a visual and descriptive overview of typical photoelectric sensor faults, their causes, and practical solutions, tailored for engineers and technicians in the electrical and automation fields. By recognizing these issues early, you can minimize downtime and ensure efficient system performance.
Common Fault Types and Visual Diagrams
Photoelectric sensor faults generally fall into categories such as no output signal, intermittent operation, false triggering, or complete failure. Diagrams illustrating these scenarios help in pinpointing the root cause. For instance, a diagram showing a sensor with no output might highlight issues like power supply failure, wiring errors, or sensor misalignment. Another diagram could depict false triggers caused by environmental factors like dust, moisture, or ambient light interference. Visual aids make it easier to identify whether the problem lies in the sensor itself, the connected circuitry, or external conditions.
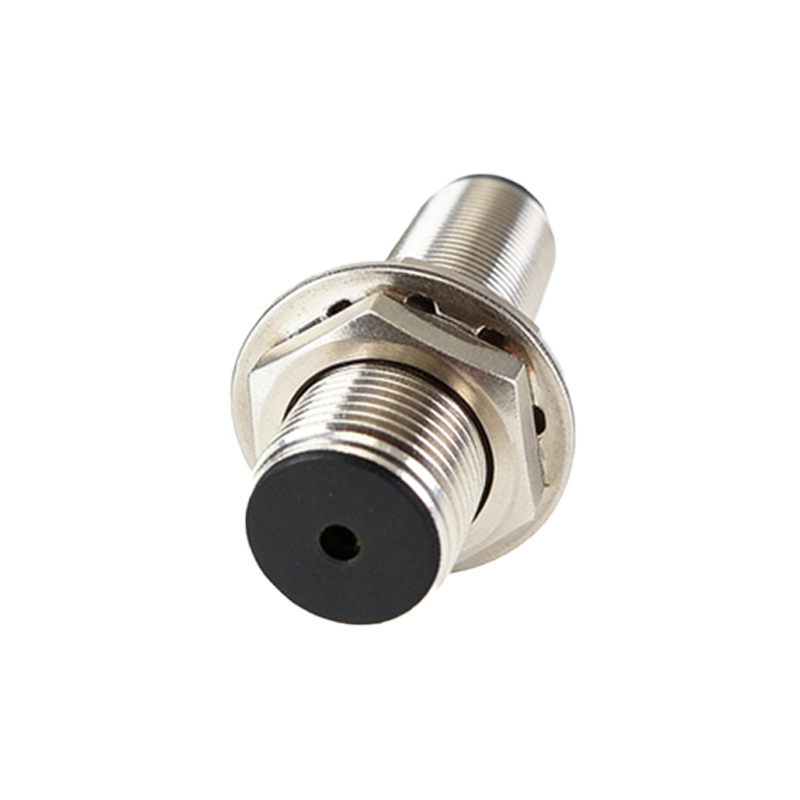
Power Supply and Wiring Faults
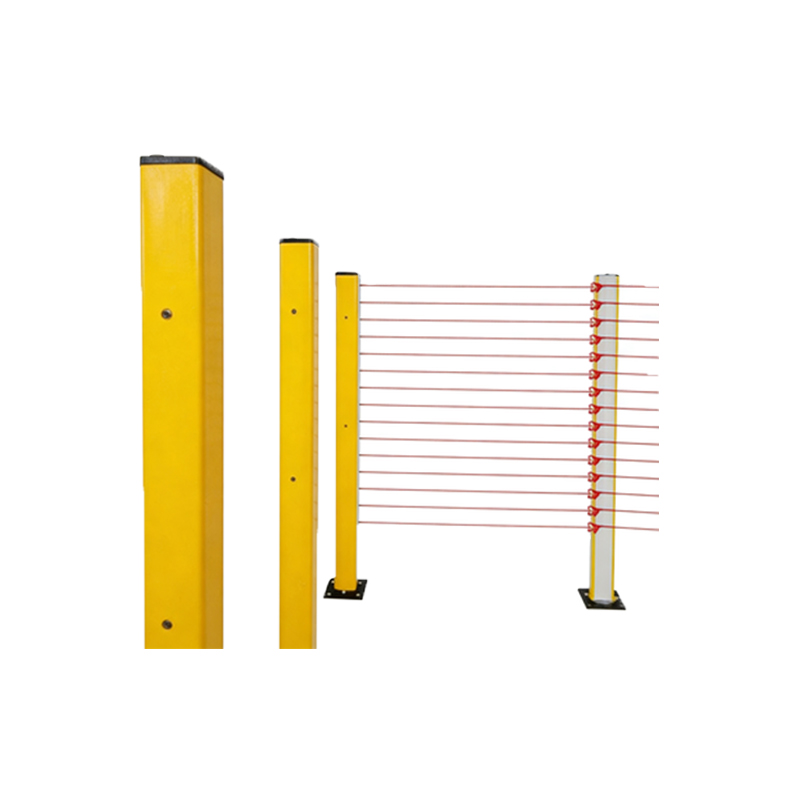
A frequent cause of photoelectric sensor malfunction is related to power and wiring. Diagrams often show incorrect voltage levels, loose connections, or reversed polarity, leading to sensor inoperability. For example, a schematic might display a sensor connected to an incompatible power source, resulting in overheating or damage. To troubleshoot, check the voltage rating on the sensor label and ensure proper grounding. Wiring diagrams can guide you in verifying cable integrity and connector tightness, preventing issues like short circuits or open loops that disrupt signal transmission.
Alignment and Optical Path Issues
Misalignment is a common fault in photoelectric sensors, especially in through-beam or retro-reflective types. Diagrams can illustrate how improper alignment between the emitter and receiver leads to weak or no signal detection. For instance, a visual guide might show the sensor pair offset by a few degrees, causing the light beam to miss the target. Solutions include realigning the sensors using alignment tools or adjusting mounting brackets. Additionally, diagrams can highlight optical path obstructions from dirt, debris, or condensation on lenses, which reduce sensitivity and require regular cleaning.
Environmental Interference Factors
Environmental conditions significantly impact photoelectric sensor performance. Diagrams often depict scenarios where factors like high ambient light, temperature extremes, or vibration cause faults. For example, a diagram might show a sensor placed near a bright light source, leading to false triggers due to light saturation. To mitigate this, use sensors with modulated light or shielding. Other diagrams could illustrate how moisture ingress or chemical exposure corrodes components, suggesting the use of IP-rated enclosures for protection in harsh environments.
Sensor Aging and Component Failure
Over time, photoelectric sensors experience wear and tear, leading to faults. Diagrams can show internal component degradation, such as LED emitter dimming or phototransistor failure, resulting in reduced sensing range or erratic behavior. For instance, a cross-sectional diagram might highlight worn-out parts that need replacement. Regular maintenance, based on manufacturer guidelines, can extend sensor life. Monitoring performance metrics and comparing them to initial specifications, as illustrated in diagnostic charts, helps in predicting failures before they cause system downtime.
Troubleshooting Steps with Diagram References
Effective troubleshooting involves systematic steps supported by diagrams. Start by verifying power and connections using wiring diagrams. Next, check alignment and cleanliness with optical path diagrams. If issues persist, refer to fault code charts or signal output diagrams to diagnose internal errors. For example, a flowchart diagram can guide you through testing procedures, such as measuring output signals with a multimeter or using diagnostic tools. Documenting findings and comparing them to standard diagrams ensures accurate problem resolution and prevents recurrence.
Preventive Maintenance Best Practices
Preventive maintenance reduces photoelectric sensor faults. Diagrams can outline schedules for cleaning lenses, inspecting cables, and testing alignment. For instance, a maintenance chart might recommend monthly checks in dusty environments or quarterly calibrations. Use diagrams to train staff on proper handling and installation techniques, avoiding common pitfalls like overtightening mounts or exposing sensors to unsuitable conditions. Implementing these practices, as visualized in maintenance guides, enhances reliability and prolongs equipment lifespan in industrial settings.
Conclusion and Further Resources
In summary, photoelectric sensor faults are manageable with the aid of diagrams that clarify causes and solutions. This guide covers key aspects from wiring to environmental factors, empowering engineers to maintain optimal performance. For more details, consult manufacturer manuals or online resources with interactive diagrams. Staying informed about advancements in sensor technology, such as smart sensors with self-diagnostic features, can further improve fault detection and efficiency in automation systems.