Introduction to Magnetic Photoelectric Sensor Imaging
Magnetic photoelectric sensors represent a critical fusion of magnetic sensing and photoelectric technology, widely employed in industrial automation for precise position detection, speed measurement, and object counting. While technical datasheets provide essential specifications, analyzing images of these sensors offers engineers invaluable practical insights. High-quality photographs and technical diagrams reveal construction details, form factors, mounting configurations, and integration methods that are often glossed over in textual descriptions. This visual analysis is crucial for proper selection, installation, and troubleshooting in complex control systems.
Decoding External Housing and Form Factor
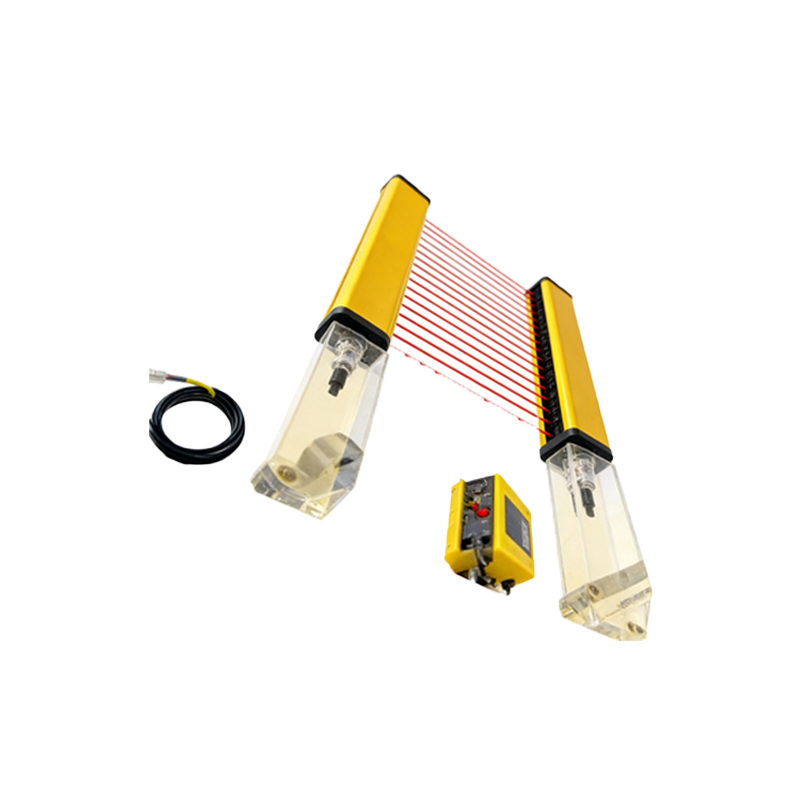
Images of magnetic photoelectric sensors first reveal the external housing, typically constructed from robust materials like PBT plastic or nickel-plated brass. Key visual elements include the sensing face, which often houses the LED indicator window. The form factor—whether tubular, rectangular, or slot-type—is immediately apparent. For instance, a tubular sensor image shows its cylindrical shape suited for drilled mounting holes, while a slot-type sensor's forked structure is designed to detect objects passing through its gap. Engineers can assess the IP (Ingress Protection) rating clues from gasket seals and lens construction visible in close-up shots, directly informing decisions for washdown or dusty environments.
Internal Component Layout and Circuitry
Cutaway or exploded-view diagrams are particularly instructive. They typically show the arrangement of the core components: the permanent magnet or magneto-resistive element, the infrared or laser light source (LED or laser diode), the phototransistor or photodiode receiver, and the signal conditioning ASIC. The spatial relationship between the magnetic field generation/detection zone and the optical path is clarified. One can observe how the magnetic element is often positioned to sense the proximity of a ferrous target, which then triggers or modulates the light beam. Images of the printed circuit board (PCB) reveal component density, trace routing, and the type of output transistor (PNP/NPN) or connection terminals, aiding in understanding current handling and wiring requirements.
Connection Interface and Wiring Schematics
Clear photographs of the sensor's connection end are essential. These images display the type of connector—whether a pre-attached cable, a quick-disconnect (M8, M12), or screw terminals. The color-coding of wires (brown for +V, blue for 0V, black for output) is standardized and visually confirmed. Accompanying wiring diagrams, often depicted in image form, illustrate the basic connection to a PLC (Programmable Logic Controller) or relay, including the necessity of a pull-up resistor for certain output types. Visualizing the wiring prevents common installation errors such as reverse polarity or incorrect load connection.
Installation and Mounting Configurations
Application photographs demonstrate real-world mounting scenarios. These images show correct sensor alignment relative to the target, such as the precise gap for a slot sensor or the stand-off distance for a opposed-mode sensor. Pictures illustrate the use of mounting brackets, adjustable holders, and the integration with machinery like conveyor belts, rotary encoders, or cylinder position feedback. Engineers can glean best practices for mechanical fixation, vibration resistance, and maintaining the critical alignment between the sensor, its magnetic field, and the optical axis to ensure reliable operation.
Target Interaction and Sensing Modes Visualization
Diagrams depicting the sensing modes—diffuse, retro-reflective, and through-beam—are highly valuable. For magnetic photoelectric variants, these images often include a representation of the magnetic field lines interacting with a ferrous metal target (like a gear tooth or actuator flag). A sequence of images might show a ferrous vane passing through a slot sensor: first disturbing the magnetic field, which then enables the photoelectric beam, causing an output state change. This visual sequence clarifies the "magnetic arm" principle common in these hybrid sensors, where the magnetic element acts as a precondition for the optical switch.
Output Signal Characterization Graphs
While not photographs, graphical images like timing diagrams and output waveforms are integral to the sensor's datasheet imagery. These graphs plot response time, switching frequency, hysteresis, and the relationship between sensing distance and target size. A visual representation of the switching lag, or the ON/OFF delay in microseconds, is more intuitive than textual description. Graphs showing the effect of ambient light or temperature on performance provide at-a-glance understanding of operational limits.
Diagnostics and Indicator LED States
Operational images or icons showing the status indicator LED are crucial for diagnostics. A typical image key will show a solid green light for power-on, a flashing green for target detection, and a red or off state for a fault or alignment error. Some advanced sensor images might depict a multi-color LED or a signal strength indicator bar. These visual cues, captured in application notes, enable quick field diagnostics without oscilloscopes or software tools, minimizing machine downtime.
Comparative Analysis with Competing Technologies
Side-by-side comparison images can be powerful. Placing a magnetic photoelectric sensor next to a standard inductive proximity sensor or a pure photoelectric sensor highlights size differences, sensing face designs, and required mounting clearances. Such visual comparisons help engineers quickly assess trade-offs in sensing range, target material restrictions, and environmental robustness when selecting the appropriate technology for an application involving ferrous metals.
Conclusion: The Value of Visual Technical Data
In conclusion, a thorough examination of magnetic photoelectric sensor images—from high-resolution product photos to detailed cross-sectional diagrams and application schematics—forms a vital part of the engineering evaluation process. This visual literacy complements numerical datasheet parameters, enabling better design-in decisions, preventing installation pitfalls, and facilitating faster troubleshooting. As sensors become more sophisticated, the ability to interpret their physical and operational imagery remains an indispensable skill for automation and electrical engineers designing reliable and efficient control systems.