Introduction to Magnetization Curves in Sensing Technology
The magnetization curve, often referred to as the B-H curve, is a fundamental concept in the design and application of inductive proximity sensors. This graphical representation plots the magnetic flux density (B) against the magnetic field strength (H) for the ferromagnetic core material within the sensor. Understanding this curve is not merely an academic exercise; it is critical for engineers to predict sensor behavior, optimize detection ranges, and ensure reliability in diverse industrial environments. The curve's shape reveals the core's saturation point, permeability, and hysteresis losses, all of which directly influence the sensor's sensitivity, response time, and overall performance. As automation demands higher precision, a deep grasp of these magnetic properties becomes indispensable for selecting the right sensor for tasks ranging from simple object detection to complex position feedback in robotic systems.
Deciphering the Key Regions of the B-H Curve
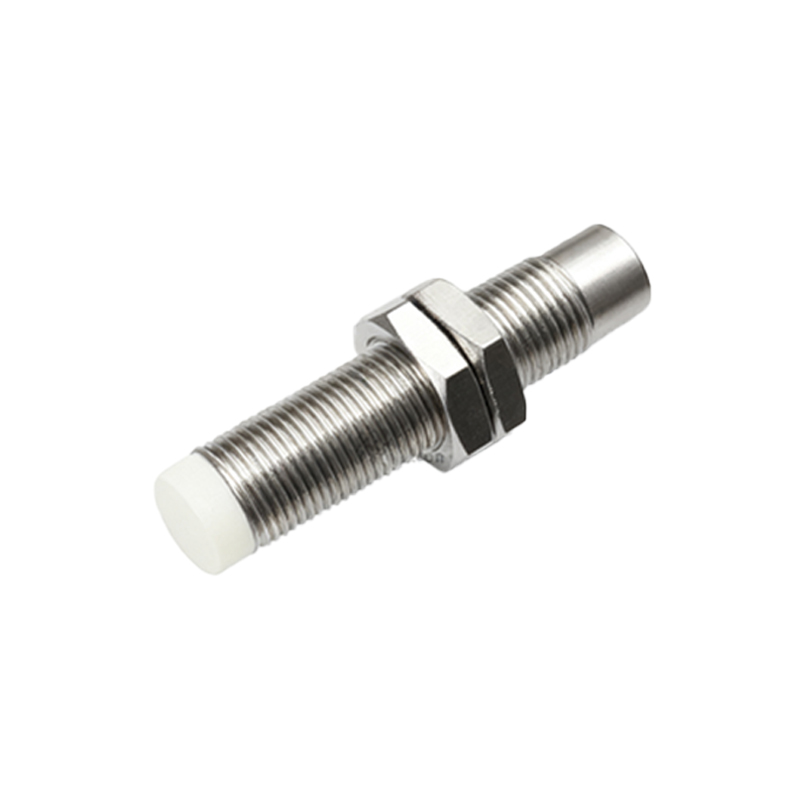
A typical magnetization curve for a proximity sensor core can be segmented into three distinct operational regions. The initial, linear region shows a proportional relationship between B and H, where the core's permeability is at its highest and most constant. This is the ideal operating zone for standard sensing applications, ensuring consistent and predictable output. As the magnetic field strength increases, the curve begins to bend, entering the knee region. Here, the core material starts to approach magnetic saturation; permeability decreases, and more field strength is required to achieve a minimal increase in flux density. Operating a sensor in this region can lead to reduced sensitivity and potential instability. Finally, the saturation region is where further increases in H yield negligible increases in B. While generally avoided for standard operation, understanding saturation limits is vital to prevent core damage and to design sensors for specific high-field applications.
Impact of Core Material on Sensor Performance
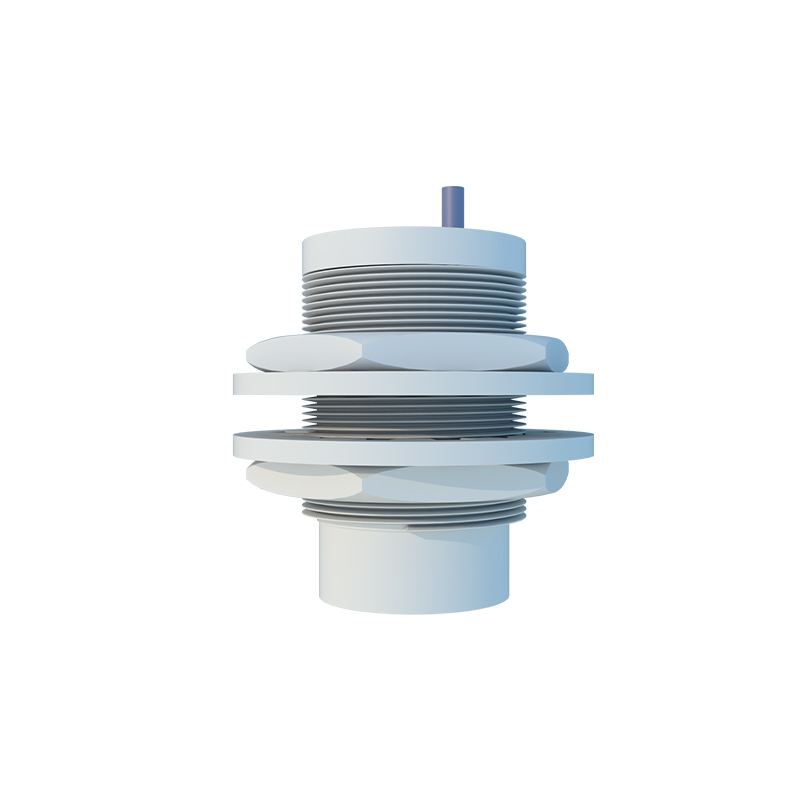
The choice of ferromagnetic core material—such as soft iron, ferrites, or specialized nickel-iron alloys—profoundly shapes the magnetization curve and, consequently, the sensor's characteristics. Materials with a high initial permeability and a low coercive force exhibit a steep, narrow B-H loop, which translates to high sensitivity and low hysteresis losses. These are preferred for high-precision, high-frequency switching applications. Conversely, materials with a broader hysteresis loop, while potentially less sensitive, may offer advantages in damping or in environments with significant magnetic interference. The core's geometry also plays a role; the effective magnetic path length and cross-sectional area are key parameters derived from the curve that influence the sensor's electromagnetic field shape and effective sensing distance. Selecting the optimal material is a trade-off between sensitivity, frequency response, temperature stability, and cost.
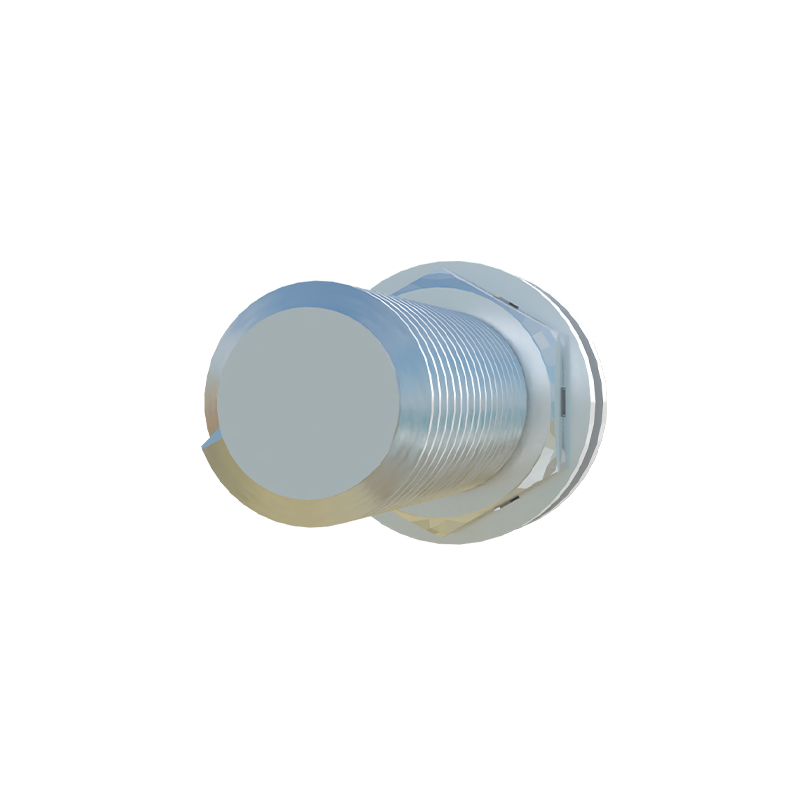
Hysteresis Loss and Its Practical Implications
The magnetization curve is not a single line but a loop, known as the hysteresis loop. The area enclosed by this loop represents the energy lost as heat during each magnetization and demagnetization cycle—the hysteresis loss. For inductive proximity sensors that operate on an AC excitation principle, this loss is a crucial factor. High hysteresis loss can lead to reduced efficiency, self-heating of the sensor, and a potential drift in the switching point over time, especially in high-cycle applications. Engineers analyze the hysteresis loop from the B-H curve to select core materials that minimize these losses for energy-efficient and reliable long-term operation. Furthermore, the width of the loop indicates the coercivity of the material, affecting how quickly the core demagnetizes, which can influence the sensor's release time and its ability to detect rapidly moving targets.
Optimizing Sensor Design Using Curve Analysis
Practical sensor design leverages the magnetization curve for critical calculations. The operating point on the curve is determined by the sensor's oscillator circuit parameters and the target's characteristics. By analyzing the curve, engineers can dimension the coil windings to ensure the core operates within its linear region for the intended sensing range, maximizing signal-to-noise ratio. The curve also informs the design of temperature compensation circuits, as the magnetic properties of the core change with temperature—a factor clearly indicated by a shift in the B-H curve. Advanced design involves creating sensors with a "flat" response in their operating zone, ensuring that minor variations in supply voltage or ambient temperature do not cause significant changes in the switching distance, thereby enhancing system robustness.
Application-Specific Considerations and Troubleshooting
In field applications, deviations from the ideal magnetization curve can signal issues or inform selection criteria. For instance, sensing different target materials (steel vs. aluminum) effectively changes the "load" on the magnetic circuit, shifting the operational point on the curve. Engineers must consult derating factors based on target material. Similarly, the presence of strong external magnetic fields or the accumulation of ferritic debris on the sensor face can prematurely drive the core towards saturation, causing a